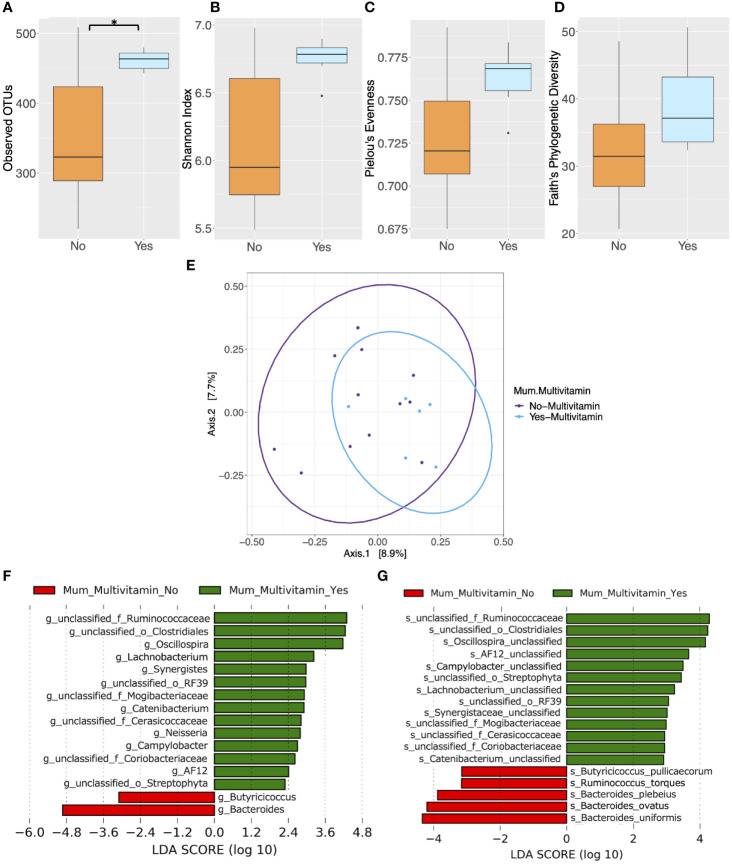
Figure 4.
Comparison of microbiota composition and diversity between mothers who took multivitamins (n = 6) and those who did not (n = 12) based on faecal samples collected at 6 months postpartum. Alpha diversity measured by (A) Observed operational taxonomic units (OTUs) (B) Shannon index (C) Pielou’s evenness (D) Faith’s phylogenetic diversity. Yes = mother took multivitamins, No = mother did not take multivitamins. Boxes represent the interquartile range (IQR), the line inside the box indicates the median and whiskers represent values 1.5 × IQR from the first and third quartiles respectively. Differences between groups were tested using the Wilcoxon sum rank test and false discovery rate (FDR) corrected. *P < 0.05 (E) Principal Coordinates Analysis (PCoA) of microbiota community structure based on maternal multivitamin intake. The points represent individual samples from mothers and the ellipse illustrates the 95% confidence intervals of multivariate normal distribution. (F) Differentially abundant bacterial genera as identified by Linear discriminant analysis Effect Size (LEfSe). (G) Differentially abundant bacterial species as identified by LEfSe. Bacterial taxa were classified as differentially abundant if their P value was < 0.05 and their linear discriminant analysis (LDA) log score was > 2. Taxa enriched in mothers who did not take multivitamins are indicated by red, and taxa enriched in those who did take multivitamins are indicated by green. Taxon levels are abbreviated with p, phylum; c, class; o, order; f, family; g, genus and s, species. LDA effects sizes and significant P values are in Supplementary Tables 10–11.

