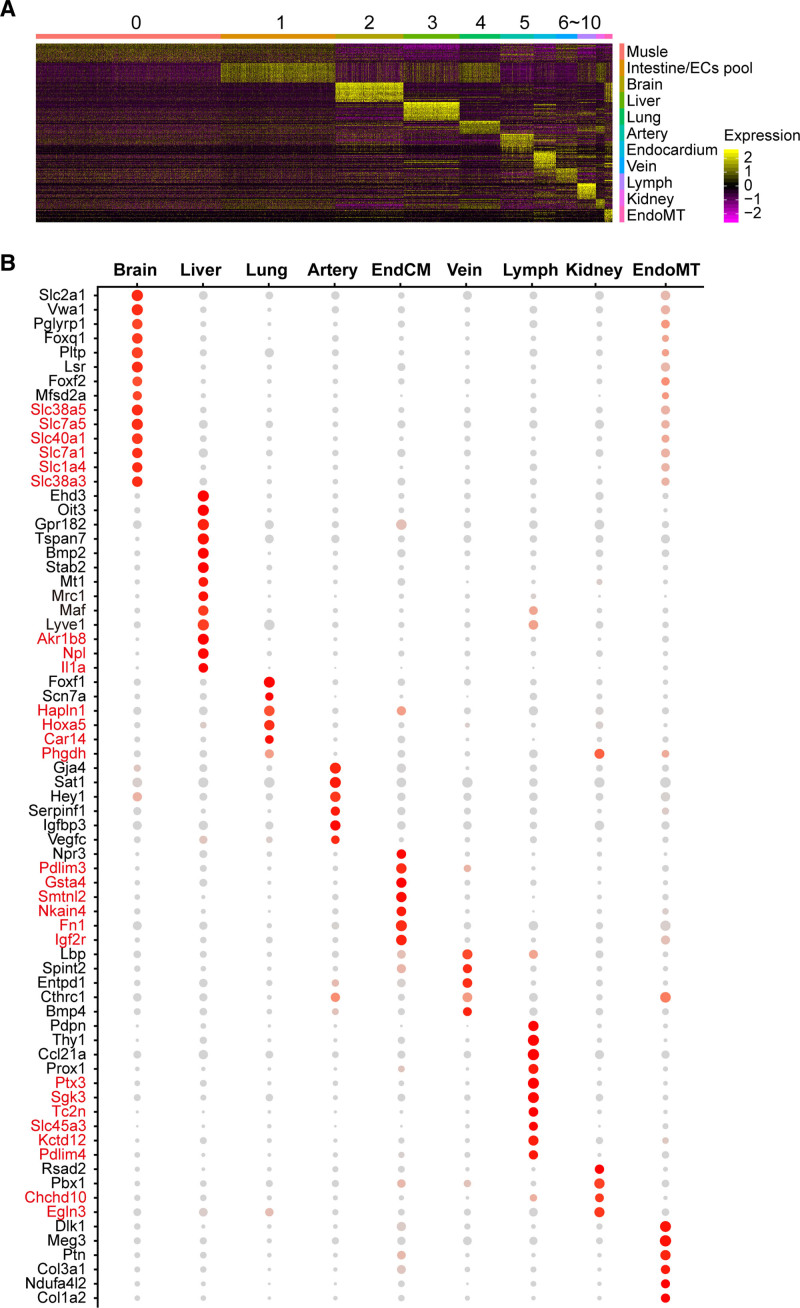
Figure 2.
Genes highly and exclusively expressed in each population of embryonic endothelial cells (eECs). A, Heat map of the top 20 enriched genes in each population reveals the heterogeneities of eECs. B, Genes highly expressed in each population of eECs were shown. The expression of genes in red font is higher in eECs than in adult endothelial cells. Dot size corresponds to percentage of cells within the cluster, and dot color corresponds to expression level. EndoMT indicates endothelial-to-mesenchymal transition.

