FIGURE 13.

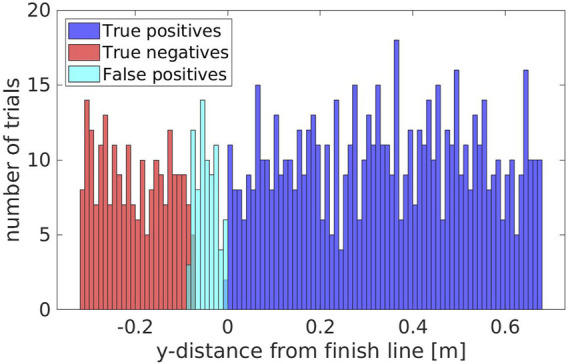
The amount of true positives/negatives and false positives/negatives grouped with respect to the y-distance from the finish line.

The amount of true positives/negatives and false positives/negatives grouped with respect to the y-distance from the finish line.