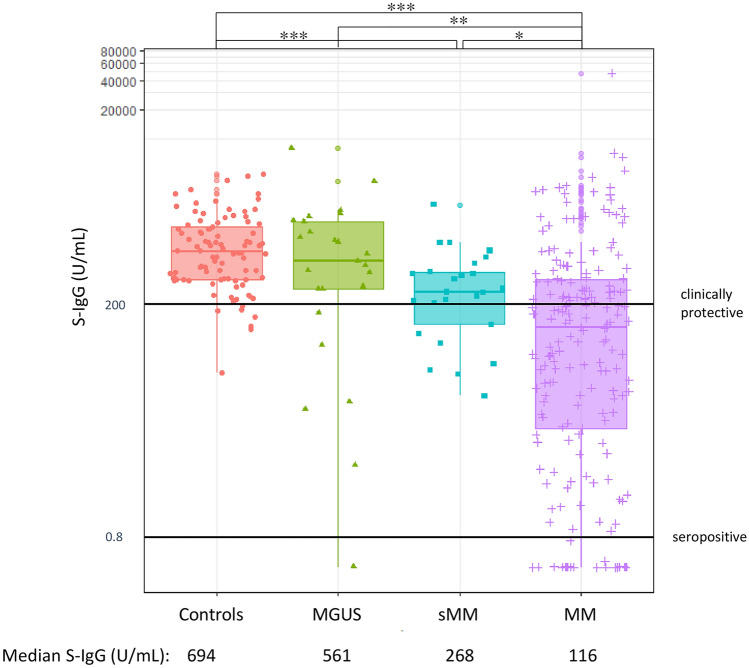
Fig. 1.
S-IgG Response at T2. Patients with symptomatic MM diminished S-IgG response (median = 116.0 U/mL, range 0.4–47,532) compared to those with smoldering MM (median = 268.0 U/mL; range 23–2127, symptomatic MM vs. sMM, p = 0.030), MGUS (median = 561.0 U/mL; range 0.4–8038, symptomatic MM vs. MGUS, p = 0.001) and healthy subjects (median = 694.0 U/mL; range: 40–4377, symptomatic MM vs. controls, p < 0.001). Significance of differences between the indicated groups was assessed using the Kruskal–Wallis test. Asterisks denote significant changes (*0.01 ≤ p < 0.05, **0.001 ≤ p < 0.01, and ***p < 0.001)

