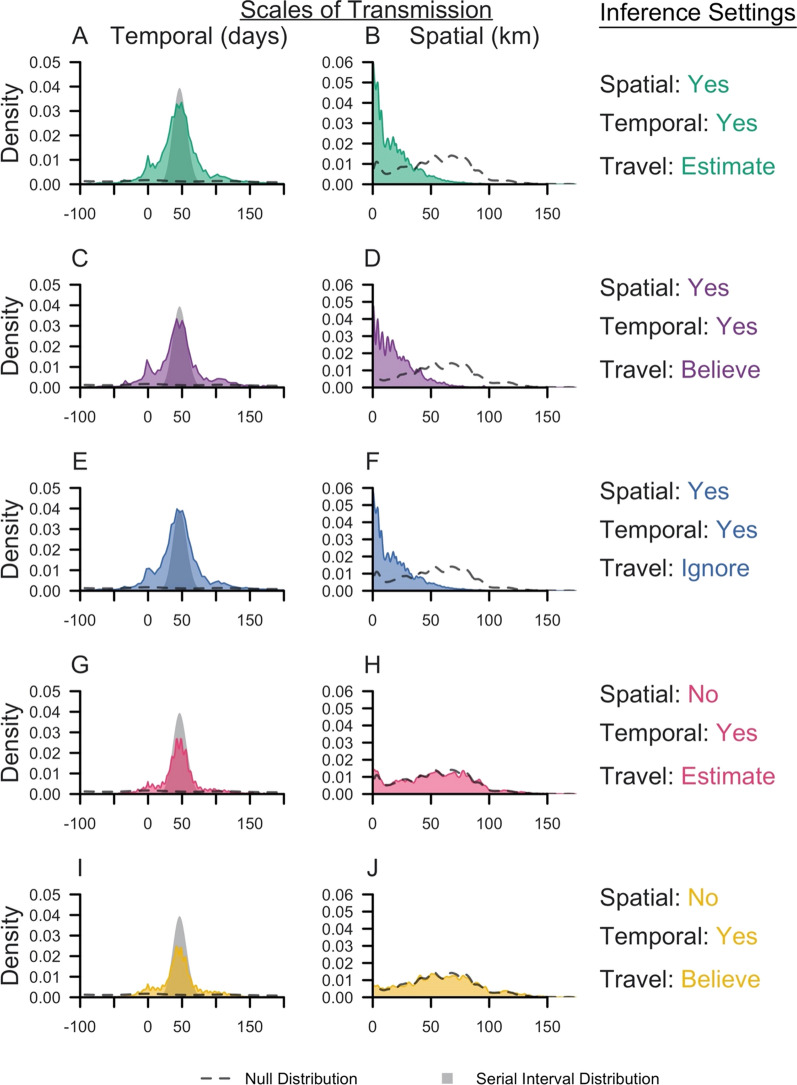
Fig. 3.
Spatial and temporal scales of transmission in Eswatini. Kernel density plots of the spatial (km) and temporal (days) scales of transmission are reported and colour-coded for each inference setting. Dashed lines indicate the corresponding null distribution, generated from all random pairs of cases in the Eswatini surveillance data set. The null distribution was different if we believed the travel history, because classification of cases on the basis of travel history reduced the pairs of cases that could be randomly sampled. The grey shape is the serial interval distribution used in the likelihood

