
Figure 2.
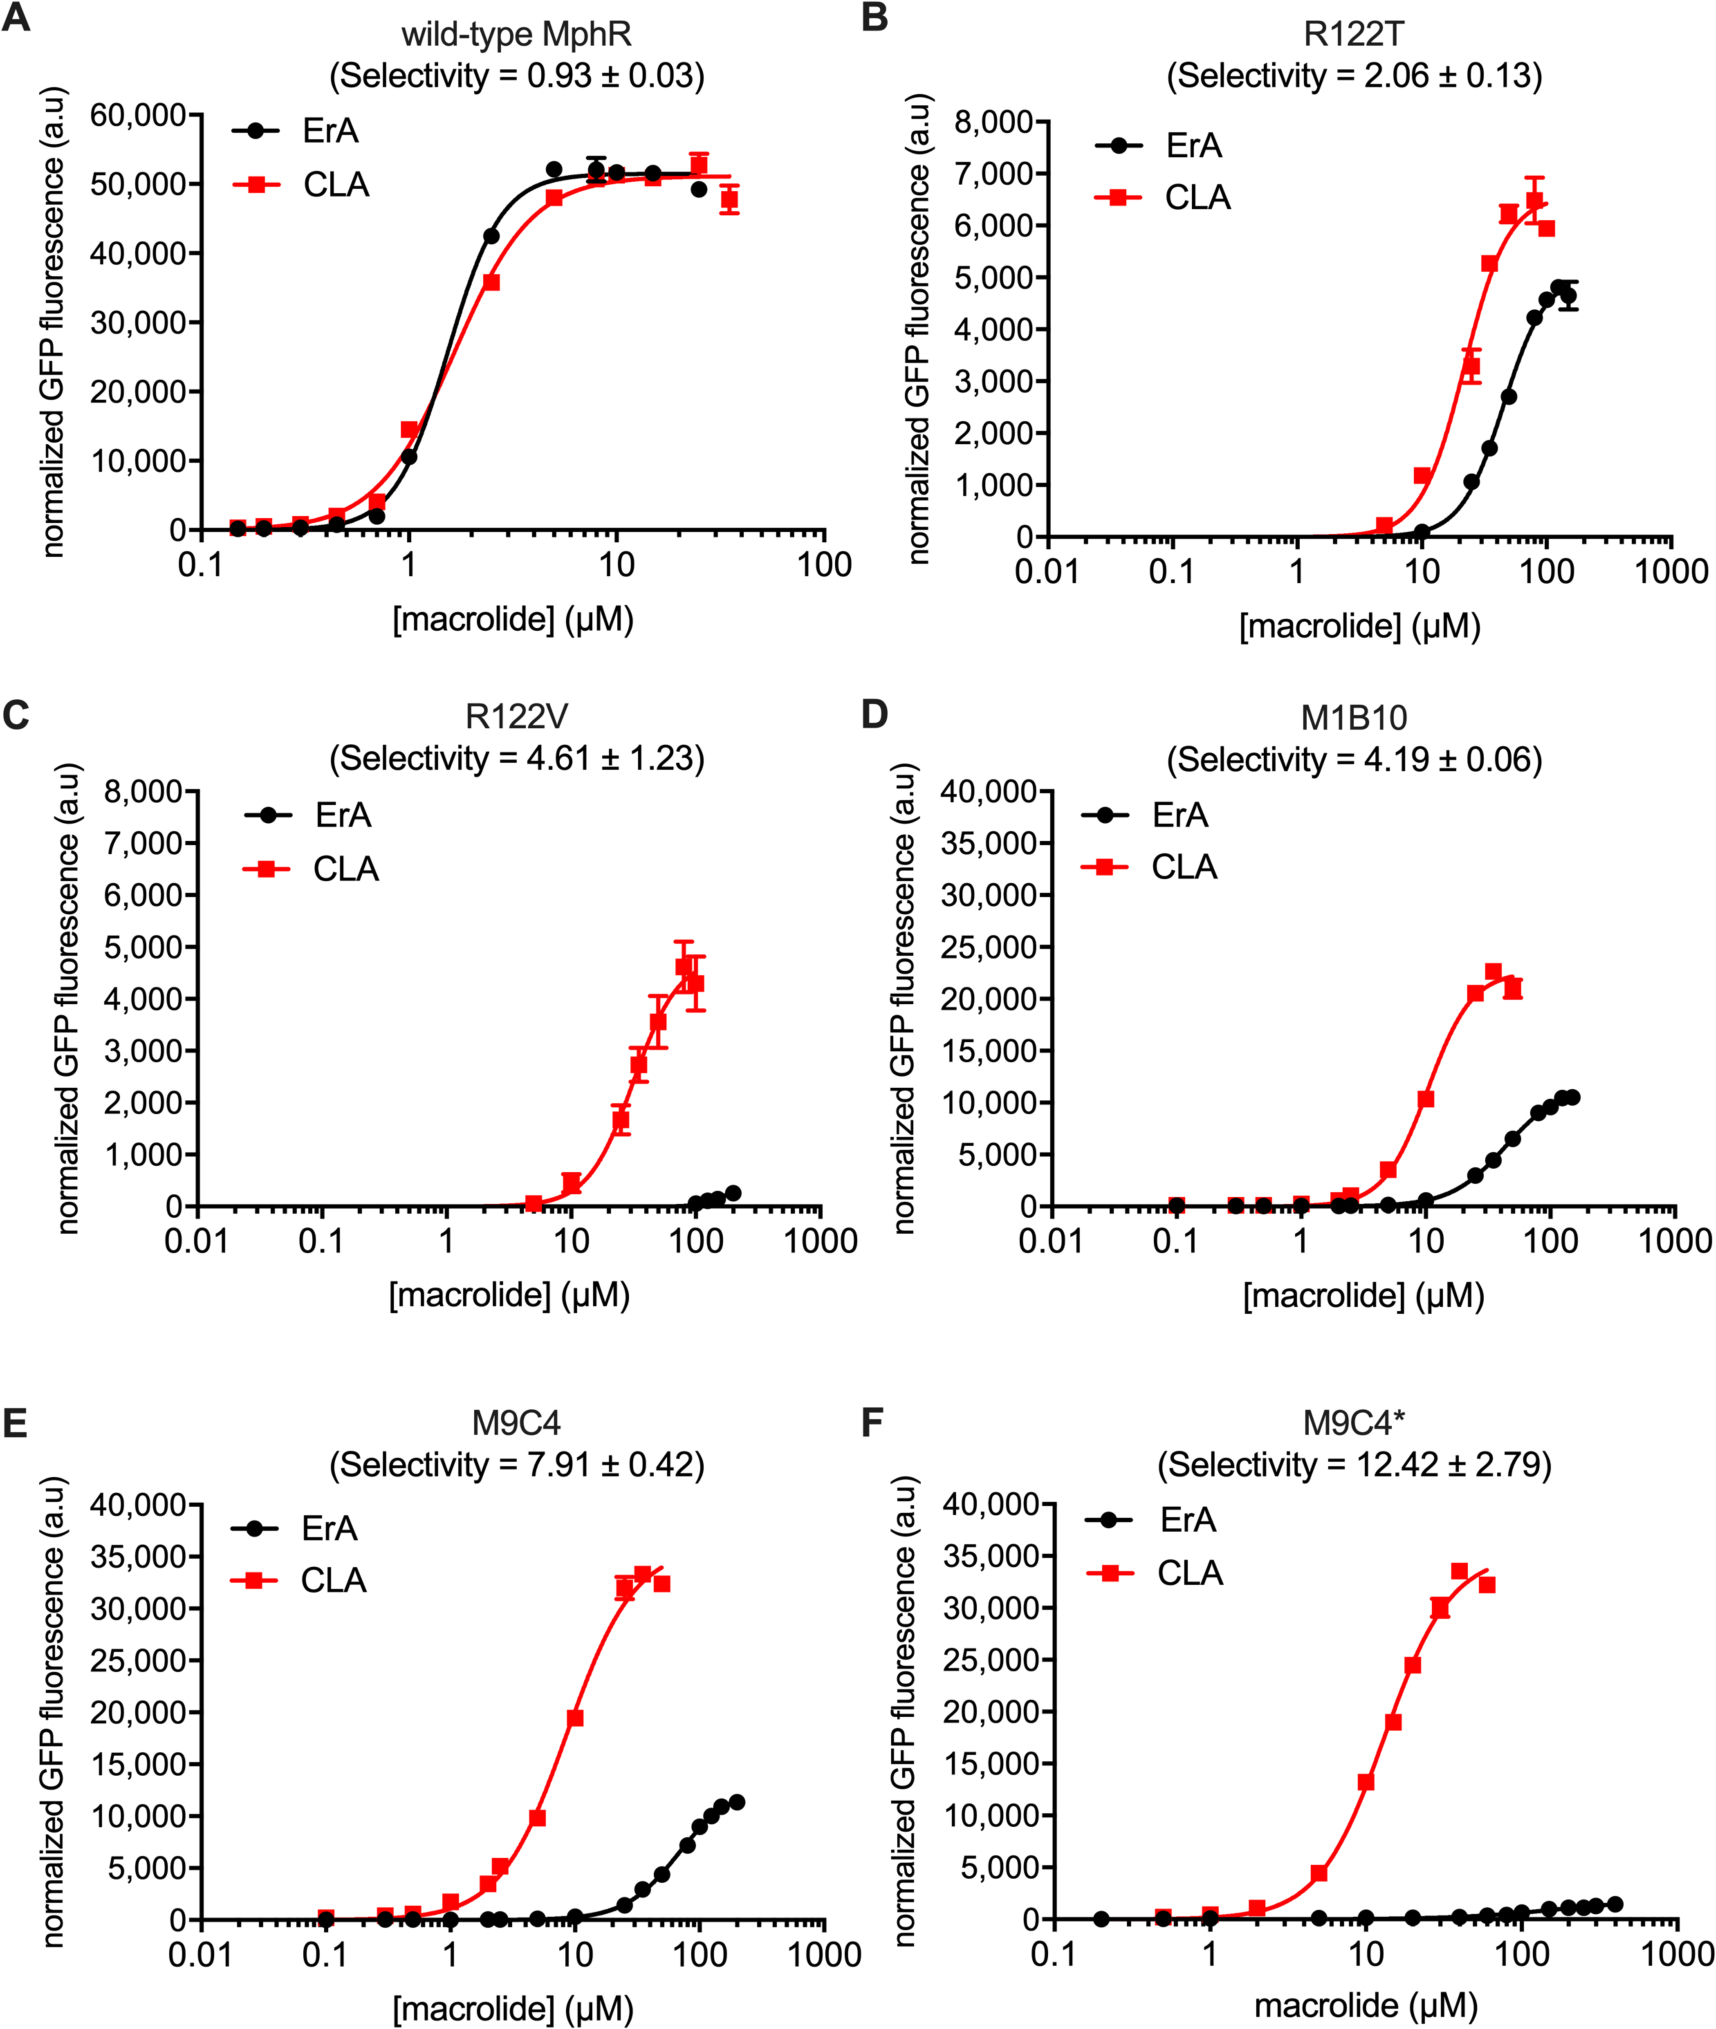
Characterization of MphR biosensor variants with engineered ErA/CLA specificity. (A) Wild-type MphR dose-response curves. (B) MphR variant R122T dose-response curves. (C) MphR variant R122V dose-response curves. (D) MphR variant M1B10 dose-response curves. (E) MphR variant M9C4 dose-response curves. (F) MphR variant M9C4* dose-response curves. Error-bars represent the standard error of the mean (n = 3) and are only visible when larger than the data point symbol.