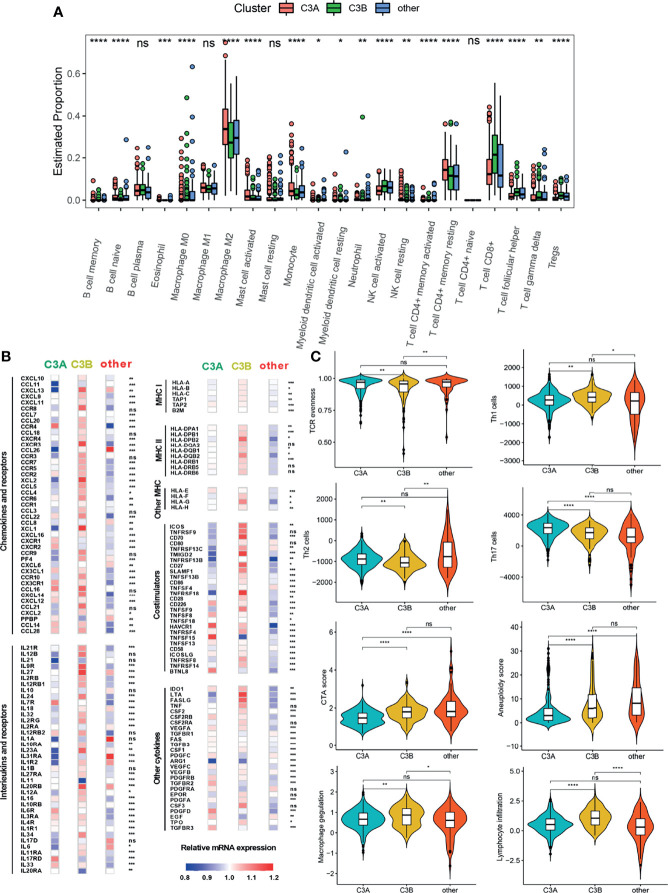
Figure 6.
The landscape of the tumor immune microenvironment in different FB-based clusters. (A) Comparison of the abundances of 22 immune cells in different subclusters. (B) Expression of chemokines, interleukins, interferons, MHC molecules, co-stimulators, co-inhibitors, and other important cytokines and their receptors in ccRCC from different subclusters. (C) Different values of vital immune characteristics in different subclusters. ccRCC, clear cell renal cell carcinoma; TCR, T cell receptor; CTA, cancer testis antigens; *p < 0.05; **p < 0.01; ***p < 0.001; ****p < 0.0001; ns, non-significance.

