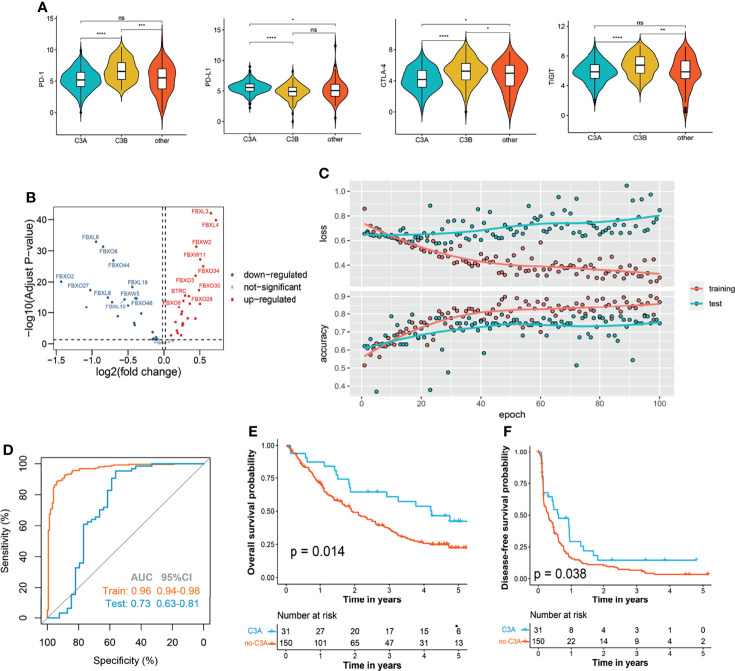
Figure 7.
Increased response to anti-PD-1 immunotherapy exists in C3A cluster. (A) Comparison of the main immune checkpoints among different clusters. (B) Volcano plot shows the differentially expressed f-box family genes. (C) The learning curves of the deep learning-based model predicting the cluster of C3A. (D) Receiver operating characteristic curves for the prediction of C3A cluster in the training and test set. (E) Kaplan–Meier survival analysis of overall survival between patients treated with ICIs in the C3A cluster and others. (F) Kaplan–Meier survival analysis of disease-free survival between patients treated with ICIs in the C3A cluster and others. ICIs, immune checkpoint inhibitors. *p < 0.05; **p < 0.01; ***p < 0.001; ****p < 0.0001; ns, non-significance.

