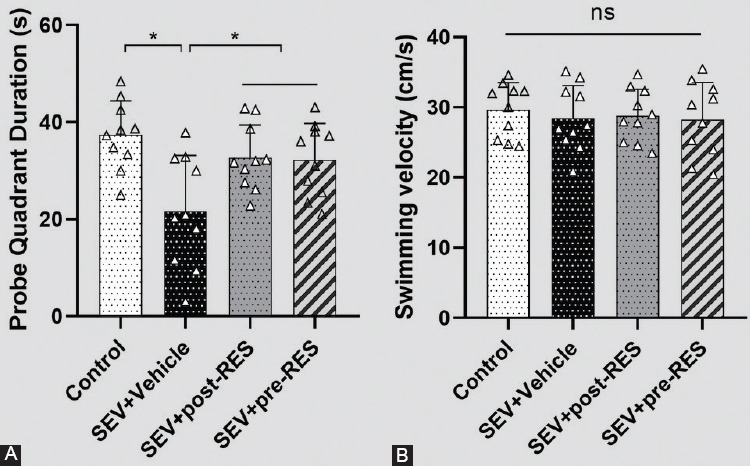
FIGURE 6.

The final test on day 6 of the Morris water maze test. (A) Quantification of the time spent in the probe quadrant in the probe trial on day 6 of the Morris water maze test. (B) Swimming velocities of different groups in the probe trial. Data are shown as the mean ± standard deviation (n = 10 per group, one-way repeated measures ANOVA, Tukey’s post hoc test). *p < 0.05; ns: Not significant.
