
FIGURE 15.
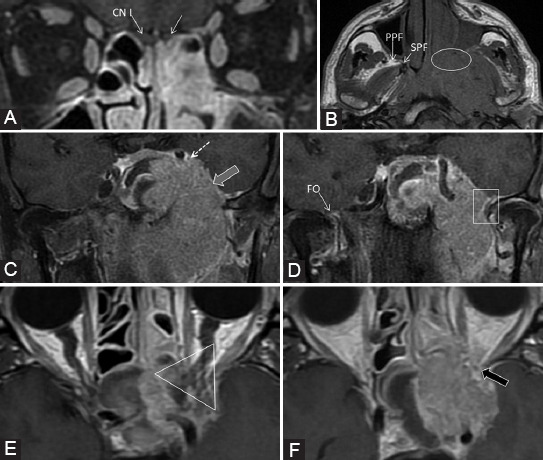
The left rhinopharyngeal squamous cell carcinoma with locoregional and skull base invasion. Coronal T1-weighted fat-saturated images (A, C, D); axial T1-weighted (B) and axial contrast-enhanced T1-weighted FSE (E, F) images. There is CE at the level of the left CN I (white arrow) which is invaded directly by the tumor (T). The PPF and sphenopalatine fissure (SPF) fat effacement (ellipse) confirms the involvement of V2 branch. There is enlargement and CE of the left Meckel’s cave (gray arrow) and cavernous sinus (dashed arrow), indicating the PNS along the CNs III, IV, V1, V2, and VI. Notice the foramen ovale invasion (CN V3, rectangle) compared to the right side (FO). The orbital apex together with the CN II is included in the tumor (triangle) and there is extension of pathologic tissue in the left superior orbital fissure (black arrow). Observe the slightly grayer appearance of CE (“evil gray”) on the non-fat-saturated sequences compared to the bright signal of fat. Notice the corresponding contralateral normal structures marked on the images.