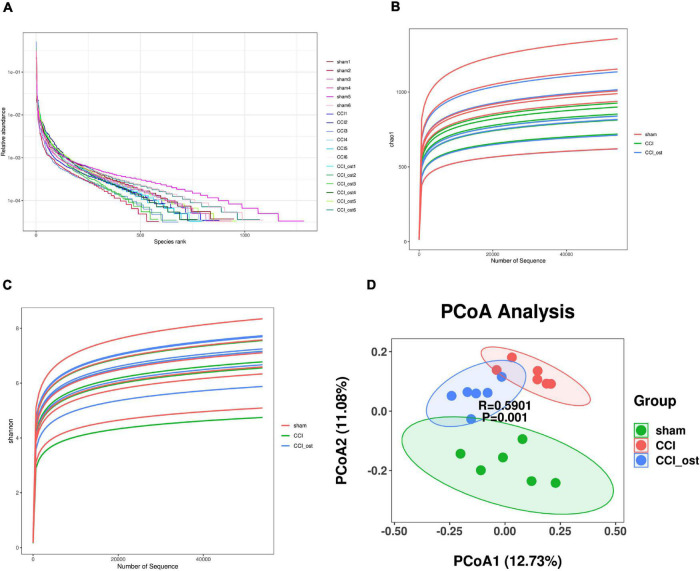
FIGURE 2.
Effects of osthole on the diversity of gut microbiota. (A) The rank abundance curves. (B) The Chao1 indices were used to estimate the diversity of the gut microbiota. (C) The Shannon indices were used to estimate the diversity of the gut microbiota. (D) Principal coordinates analysis (PCoA) diagram illustrating the difference in microbial composition among the three groups.

