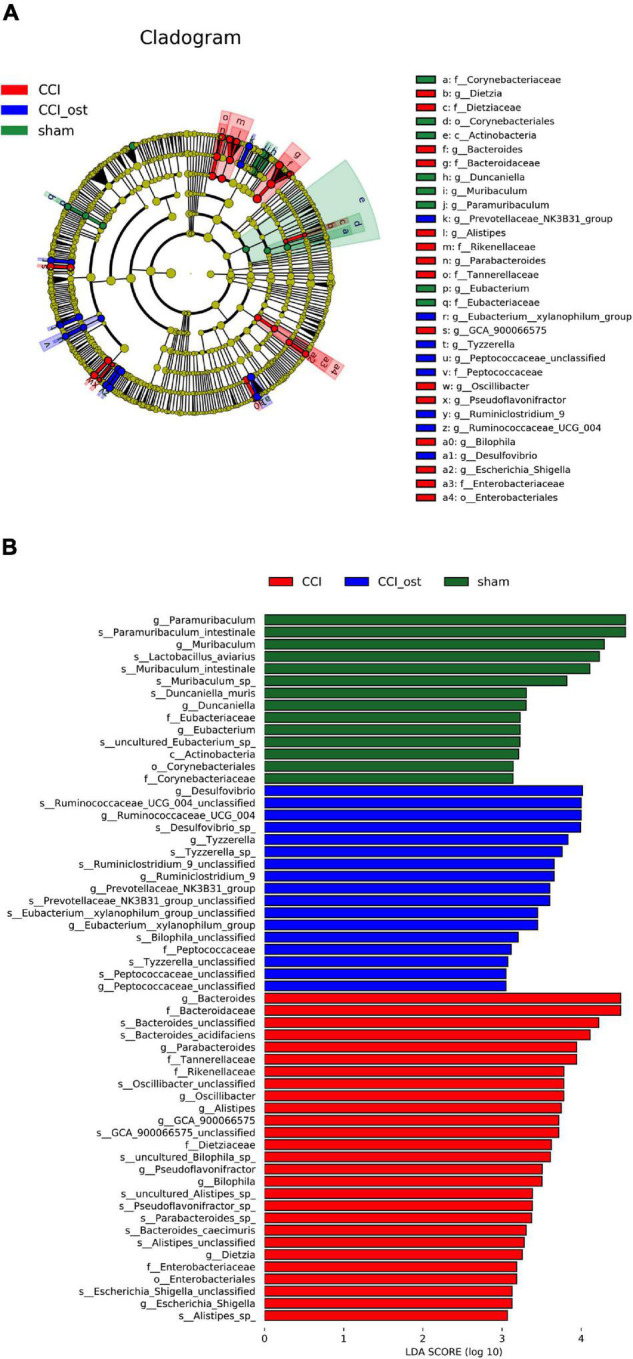
FIGURE 4.

Identification of most specific bacterial taxa by LEfSe analysis. Comparison of gut microbiota composition among experimental groups based on linear discriminant analysis (LDA) effect size (LEfSe) (A) and LDA (B). Dot sizes are proportional to the abundance of certain taxa in the taxonomic cladogram, and the greatest differences among groups after LDA using a threshold score of >4.0.
