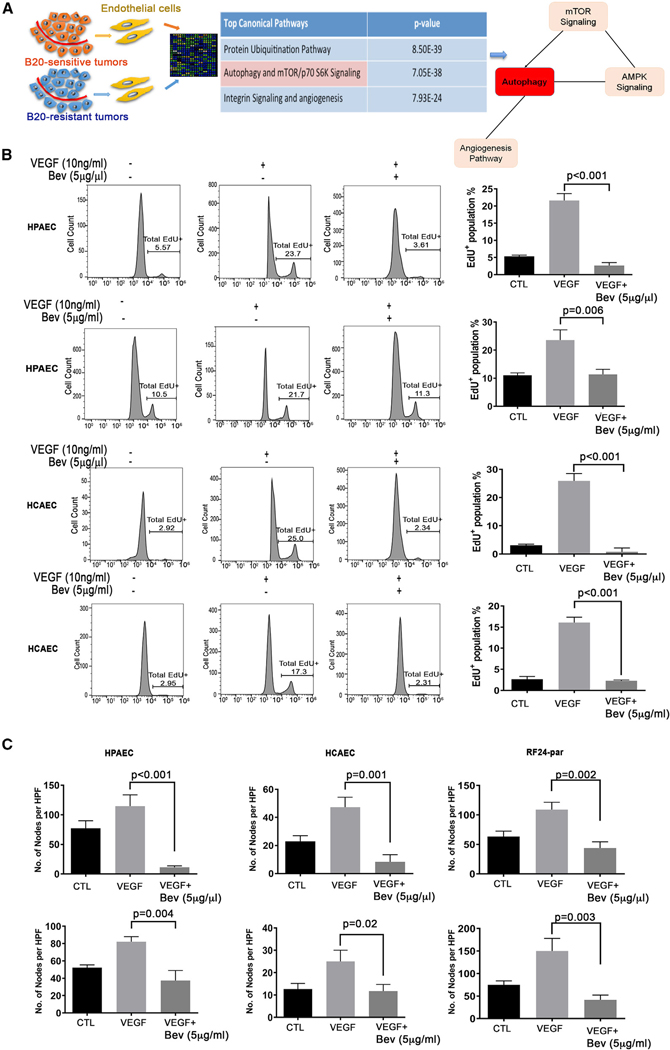
Figure 1. Cellular effects of different doses of AVA therapy in ECs.
(A) Schematic representing Ingenuity Pathway Analysis of a cDNA microarray of ECs isolated from anti-VEGF-A antibody (B20)-sensitive ID8 tumors and B20-resistant ID8 tumors.
(B) Effects of AVA therapy on proliferation of human primary ECs. Human primary pulmonary artery ECs (HPAECs) and human primary coronary artery ECs (HCAECs) were treated with control (CTL), VEGF only, or VEGF in combination with Bev at two different dosages, 5 μg/μL (higher dose) or 5 μg/mL (lower dose), and proliferation was assessed by 5-ethynyl-2-deoxyuridine (5-EdU+) incorporation. Representative flow plots are shown on the left, and graphs are shown on the right. Data are expressed as mean ± SD, determined by two-tailed Student’s t test (n = 3).
(C) Formation of tube nodes in HPAECs, HCAECs, and parental RF24 cells (RF24-par) under the same treatments as in (B) Data are expressed as mean ± SD, two-sided Student’s t test (n = 3).

