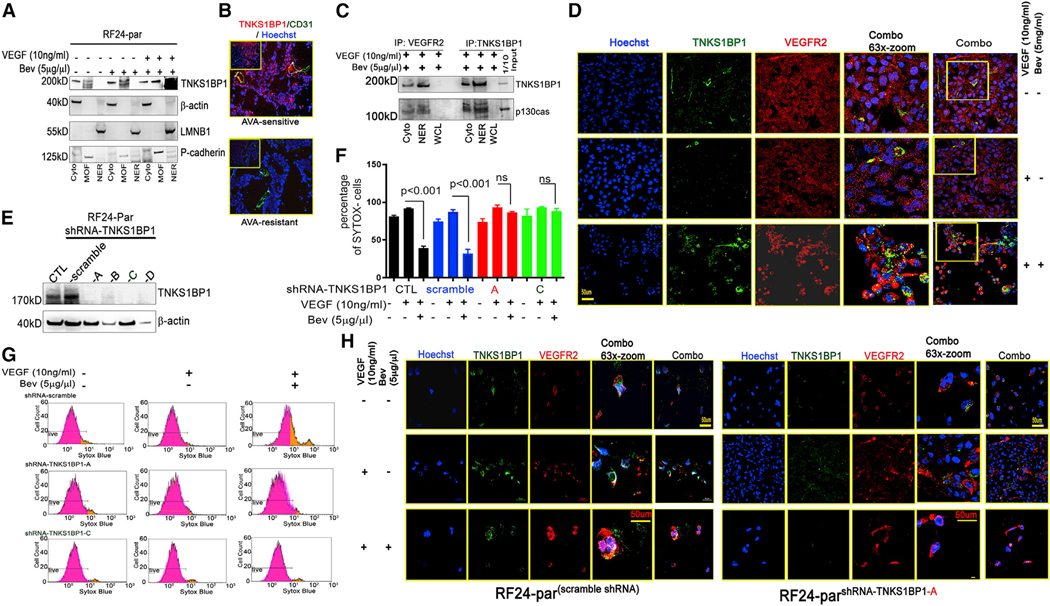
Figure 4. TNKS1BP1 and nuclear VEGFR2 mediate AVA therapy-induced EC death.
(A) Nuclear TNKS1BP1 enrichment in RF24-par cells in response to Bev treatment. MOF, membranous fraction. β-Actin was used as Cyto CTL, p-cadherin as MOF CTL, and LMNB1 as NER CTL.
(B) Expression of endothelial TNKS1BP1, shown by dual immunofluorescence staining for TNKS1BP1 (red) and CD31 (green), in ovarian tumor samples that were sensitive or resistant to AVA therapy (Bev).
(C) Co-immunoprecipitation (coIP) of VEGFR2 and TNKS1BP1 in RF24-par cells under Bev treatment. The anti-VEGFR2 and anti-TNKS1BP1 immunoprecipitates were re-probed with an anti-p130cas antibody.
(D) Representative confocal microscopy images showing TNKS1BP1 (green) and VEGFR2 (red) distributed into the NUs of RF24-par cells in response to Bev treatment (VEGF + Bev); this is distinctly different from the expression patterns in cells treated with CTL or VEGF only. Scale bar, 50 μm; n = 3.
(E) Knockdown of TNKS1BP1 in RF24-par cells with shRNAs (A–D).
(F and G) The graph shows mean numbers of SYTOX— live cells for each treatment group (F; data are expressed as mean ± SD, n = 3, p < 0.001 or not significant [ns], two-tailed Student’s t test. Notably, in cells treated with scramble shRNA, the percentage of SYTOX— viable cells was 36.3% under VEGF + Bev treatment; in cells transfected with shRNA A or C, the percentages of SYTOX— live cells were 72.61% and 84.98%, respectively, under VEGF + Bev treatment. Also shown are representative plots of SYTOX— populations from FACS analysis of RF24-par cells transfected with scramble shRNA, shRNA A, or shRNA C against TNKS1BP1 and treated with CTL, VEGF only, or VEGF + Bev (G).
(H) Representative confocal images showing nuclear TNKS1BP1 and VEGFR2 in RF24-parscramble shRNA cells; VEGFR2 remained at the membrane in RF24-parshRNA-TNKS1BP1—A cells under VEGF + Bev treatment. Scale bar, 50 mm; n = 3.

