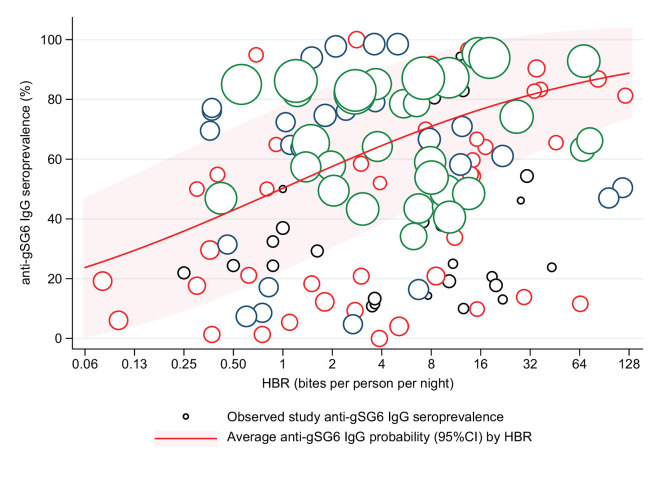
Figure 2. Association between anti-gSG6 IgG seroprevalence and log2 human biting rate (HBR).
Figure shows the observed anti-gSG6 (either recombinant or peptide form) IgG seroprevalence (%) and HBR for each study-specific observation, as well as the predicted average anti-gSG6 IgG seroprevalence (predicted probability for the average study and country) with 95% confidence intervals (95% CI). Circles are proportional to the size of the sample for each study-specific observation, with colours indicating sample size: black (<50), red (50–100), navy (100–150), and green (>150). Association estimated using generalised linear multilevel modelling (mixed effects, logistic) to account for the hierarchical nature of the data, where study-specific anti-gSG6 IgG observations are nested within study and study is nested within country (model output shown in Appendix 4; p<0.001).
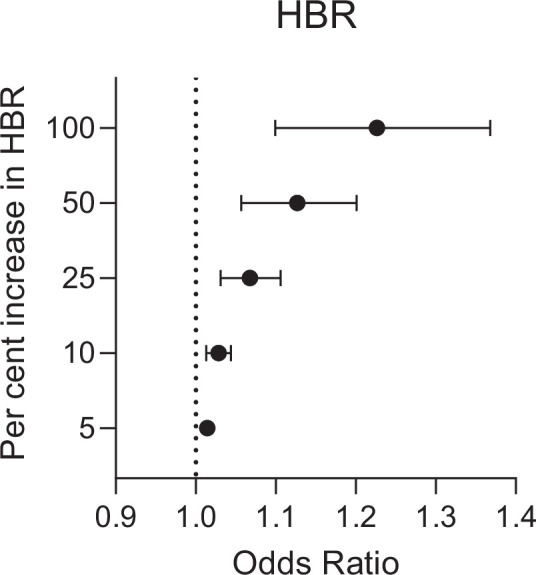
Figure 2—figure supplement 1. Estimated relative change in odds of anti-gSG6 IgG seropositivity (95% confidence interval) for given relative percent increases in human biting rate (HBR) (bites/person/night).


