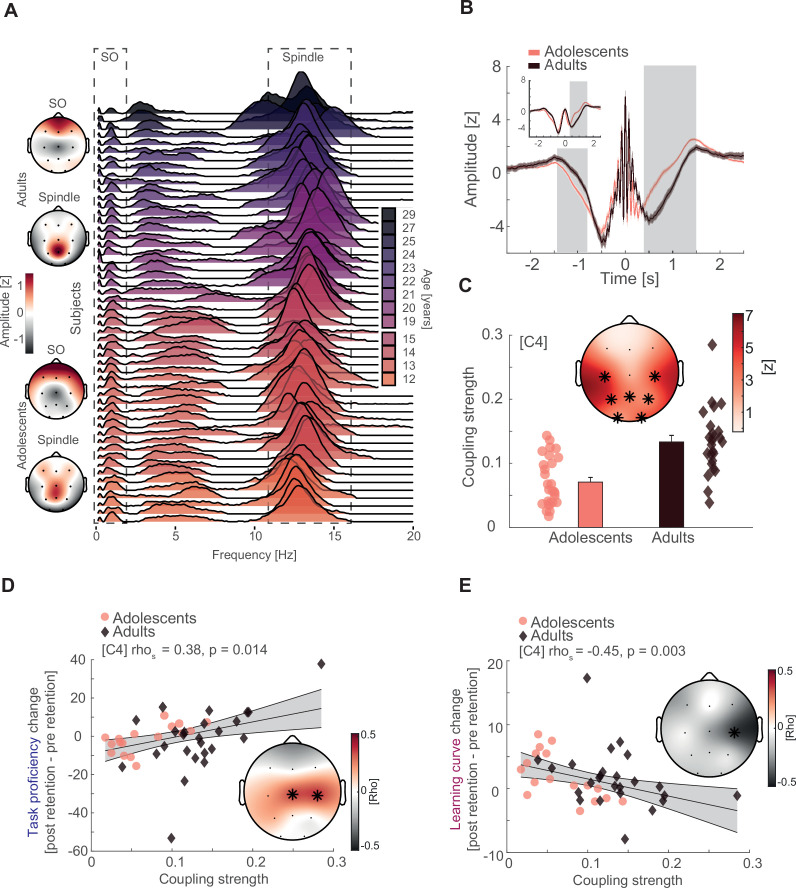
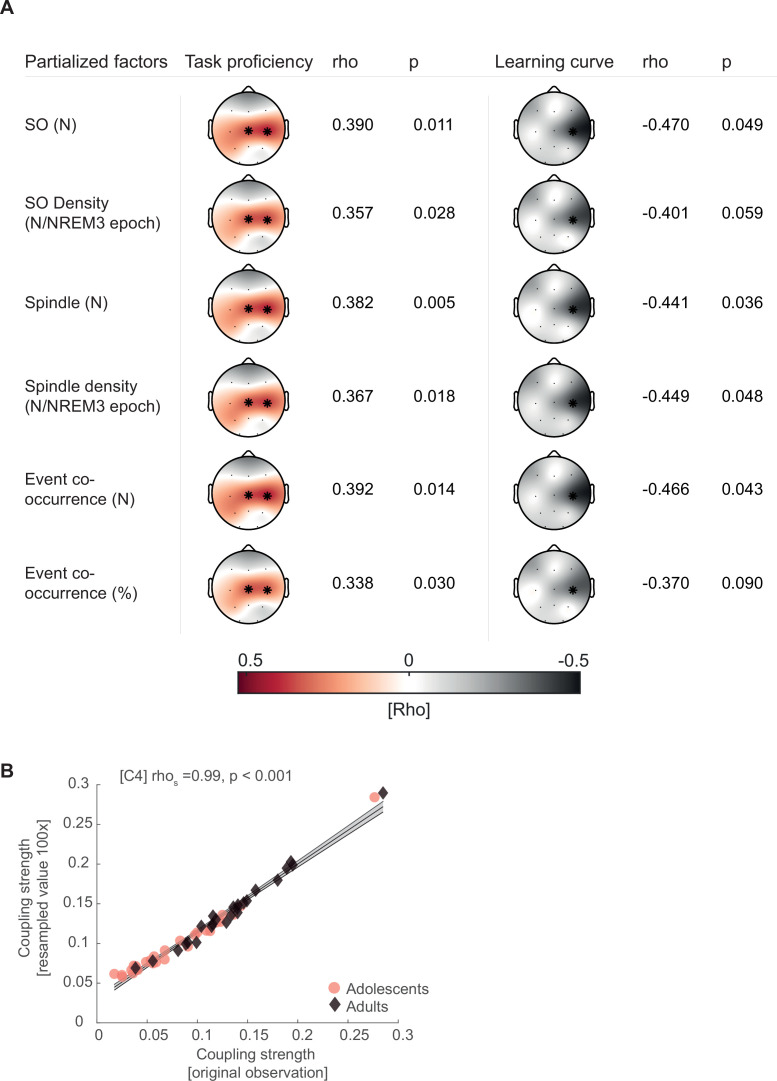
Figure 3. Interindividual variability, slow oscillation (SO)–spindle coupling development, and neural correlates of gross-motor learning dynamics.
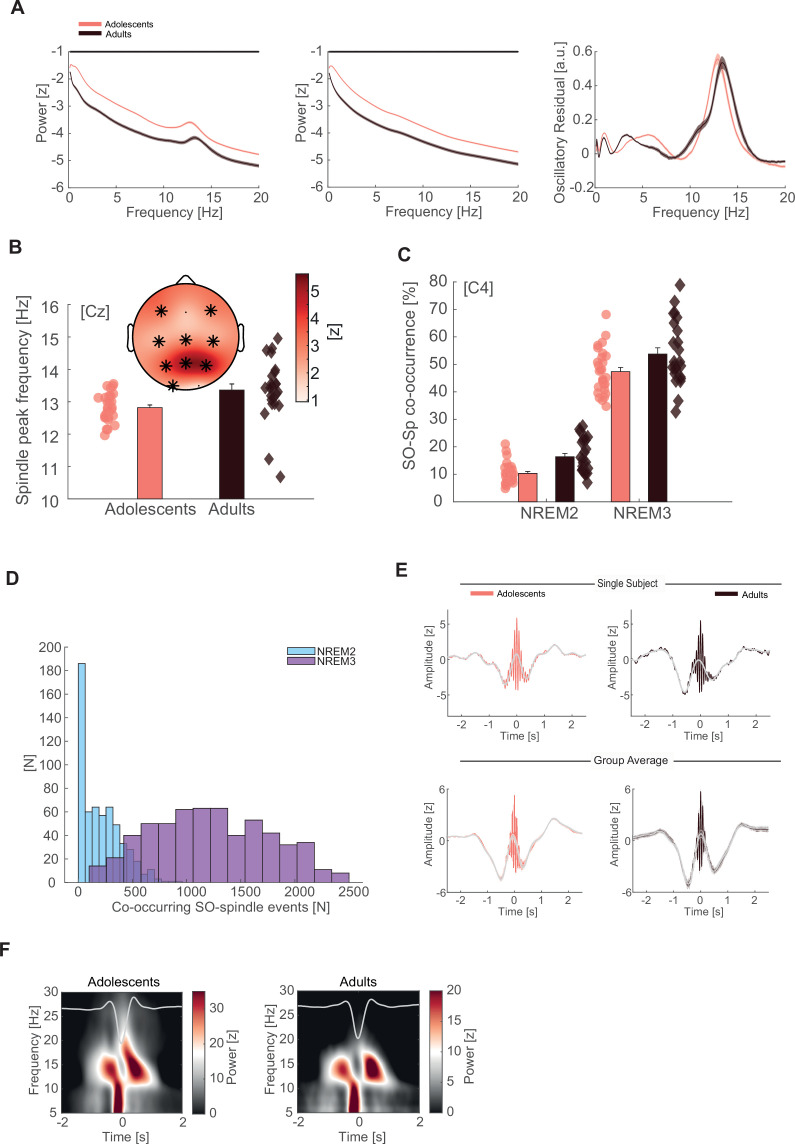
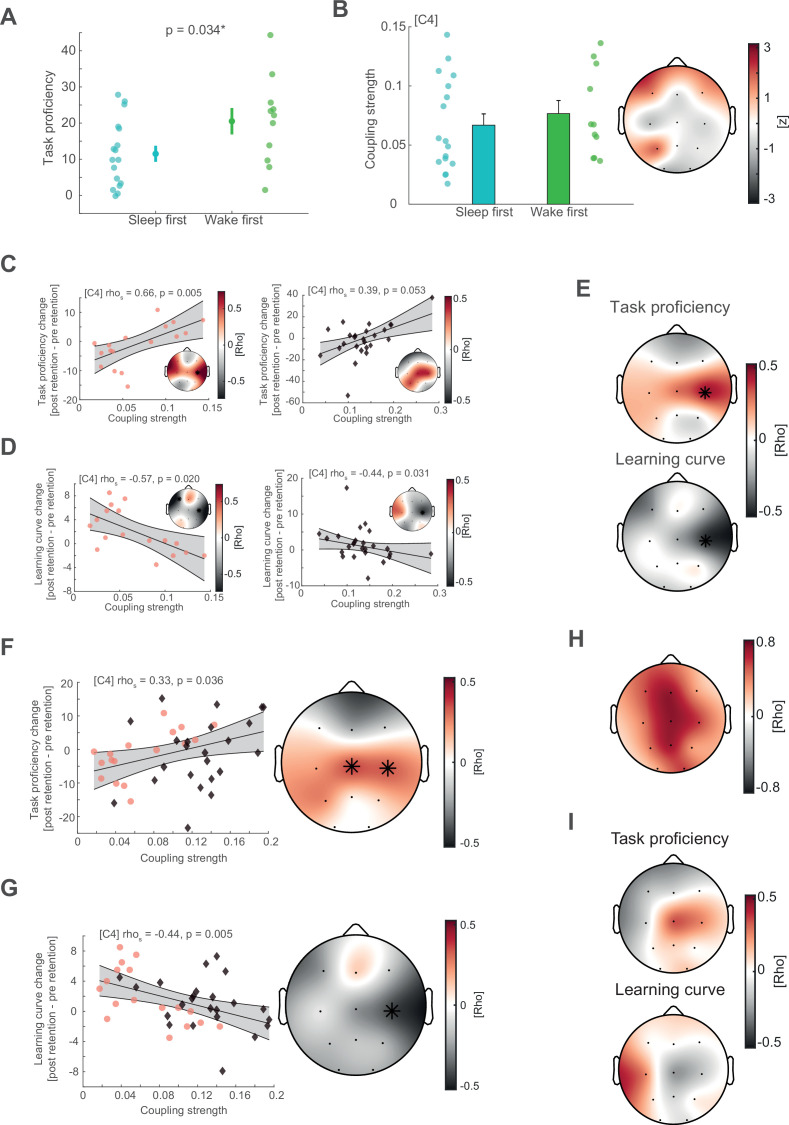
(A) Left: topographical distribution of the 1/f corrected SO and spindle amplitude as extracted from the oscillatory residual (Figure 3—figure supplement 1A, right). Note that adolescents and adults both display the expected topographical distribution of more pronounced frontal SO and centroparietal spindles. Right: single subject data of the oscillatory residual for all subjects with sleep data color coded by age (darker colors indicate older subjects). SO and spindle frequency ranges are indicated by the dashed boxes. Importantly, subjects displayed high interindividual variability in the sleep spindle range and a gradual spindle frequency increase by age that is critically underestimated by the group average of the oscillatory residuals (Figure 3—figure supplement 1A, right). (B) Spindle peak locked epoch (NREM3, co-occurrence corrected) grand averages (mean ± standard error of the mean [SEM]) for adolescents (red) and adults (black). Inset depicts the corresponding SO-filtered (2 Hz lowpass) signal. Gray-shaded areas indicate significant clusters. Note, we found no difference in amplitude after normalization. Significant differences are due to more precise SO–spindle coupling in adults. (C) Top: comparison of SO–spindle coupling strength between adolescents and adults. Adults displayed more precise coupling than adolescents in a centroparietal cluster. T-Scores are transformed to z-scores. Asterisks denote cluster-corrected two-sided p < 0.05. Bottom: Exemplary depiction of coupling strength (mean ± SEM) for adolescents (red) and adults (black) with single subject data points. Exemplary single electrode data (bottom) is shown for C4 instead of Cz to visualize the difference. (D) Cluster-corrected correlations between individual coupling strength and overnight task proficiency change (post–preretention) for adolescents (red, circle) and adults (black, diamond) of the sleep-first group (left, data at C4). Asterisks indicate cluster-corrected two-sided p < 0.05. Gray-shaded area indicates 95% confidence intervals of the trend line. Participants with a more precise SO–spindle coordination show improved task proficiency after sleep. Note that the change in task proficiency was inversely related to the change in learning curve (Figure 2F), indicating that a stronger improvement in task proficiency related to a flattening of the learning curve. Further note that the significant cluster formed over electrodes close to motor areas. (E) Cluster-corrected correlations between individual coupling strength and overnight learning curve change. Same conventions as in (D). Participants with more precise SO–spindle coupling over C4 showed attenuated learning curves after sleep.

