. 2022 Feb 21;11:e72707. doi: 10.7554/eLife.72707

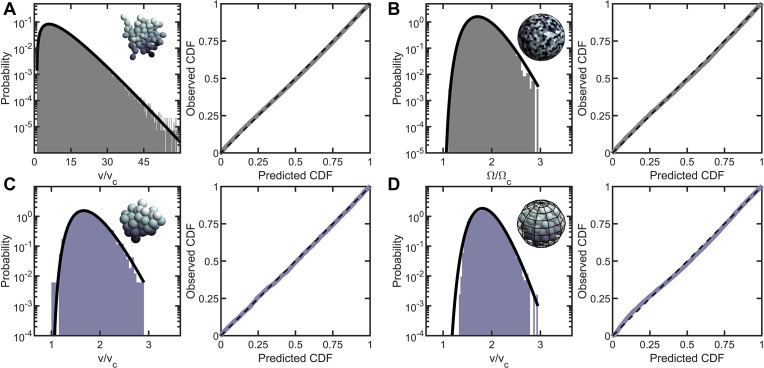
Figure 2. Entropic packing is a general feature of simple multicellularity.

We simulated four different growth morphologies: (A) Tree-like groups formed with rigid, permanent bonds between cells, (B) surface-attached cells located on a spherical surface, (C) aggregates formed with attractive ‘sticky’ interactions, and (D) groups formed by rapid cell division within a maternal membrane. In all subfigures, left panel shows the predicted and observed probability distributions, and right panel plots the observed cumulative distribution vs. the expected cumulative distribution. Histogram bars represent measured Voronoi volume distribution in simulations, and black solid line represents the maximum entropy prediction. Maximum entropy predictions accurately described the distribution of cellular volumes/areas, despite their varying mechanisms of group formation (rRMS0.01).

Figure 2—source data 1. Simulation data (enumerating the cell center positions) for the six classes of numerical studies; aggregation, apoptosis, polydispersity, snowflake yeast growth, tree-like growth, and Volvox growth.
Each subdirectory contains an explanatory README file.

Figure 2.

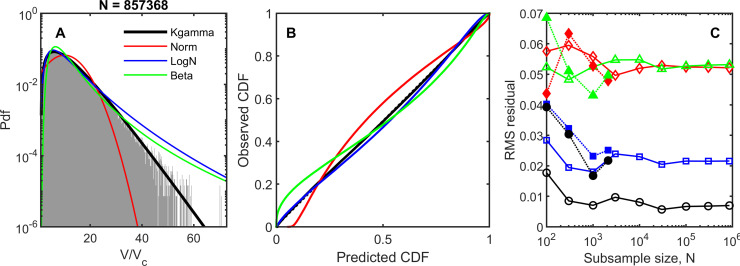
Figure 2—figure supplement 1. Four different distributions were tested for goodness-of-fit: the maximum entropy prediction (black line), the normal distribution (red), the log-normal distribution (blue), and the beta-prime distribution (green).

Figure 2—figure supplement 1.

(A) Probability distribution functions for the dataset and the four model distributions, using parameters measured from the dataset. All measured values were used for this plot (number of datapoints, N=857368). (B) Empirical cumulative distribution function vs. predicted cumulative distribution function. Black dashed line corresponds to perfect agreement, y=x. (C) Root-mean-square residual of the cumulative distribution functions for various sample sizes bootstrapped from the dataset. In open symbols are simulation datasets: black circle is k-gamma, red diamond is normal, blue square is log-normal, and green triangle is beta-prime. We also include data from snowflake yeast experiments; these bootstrapped samples are shown as dotted lines with filled symbols.
Figure 2—figure supplement 2. Four different distributions were used to estimate the skewness of the distribution given the first two moments (A).

Figure 2—figure supplement 2.

We show the percent error of the estimated skewness ((Est-True)/True) for both experimental data (left bars, bright) and simulation data (right bars, dark). (B-C), Four different distributions were fit using a least-squares algorithm; the fit distributions were then compared to the experimentally observed distribution by comparing their first two moments. The mean is show in B, the standard deviation in C. Experimental data was used for least square fits in the left-side bars for each pair, simulation data was used in the right-side bars for each pair.
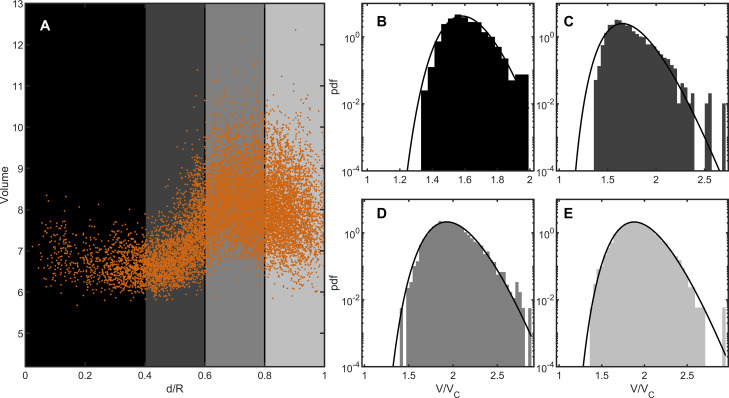
Figure 2—figure supplement 3. In simulations of palintomy within a confining membrane, boundary effects due to frustrated packing near a wall affect the local packing fraction, but do not change the general distribution.

Figure 2—figure supplement 3.

(A) Voronoi polyhedron volume, V, vs. distance from the center of mass, d. The distance d is normalized by the maximum distance R of any cell for each group; the volume is normalized by the minimum cell volume Vc=4/3πr3. All simulations are shown together as orange points. The colored partitions correspond to spherical shells. Panels B-E show the distribution of Voronoi volumes within each shell. In all cases, the k-gamma distribution describes the data well (rRMS=[0.017,0.035,0.011,0.004], respectively).