
Figure 5.
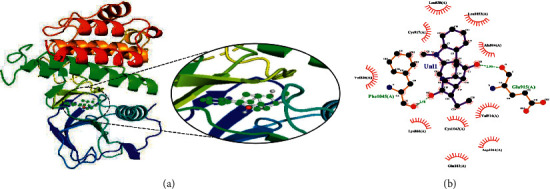
The binding pattern of ajmaline derived from R. serpentina with VEGFR-2. Panel (a) shows the 3D interaction of VEGFR-2 with ajmaline visualized using PyMol. Panel (b) represents the 2D image of the molecular interactions between the protein and ligand generated by Ligplot+ v.2.2.4. The green dashed lines and the spiked red arcs represent the hydrogen bonds with bond distance and the residues involved in hydrophobic interactions, respectively.