
Figure 5.
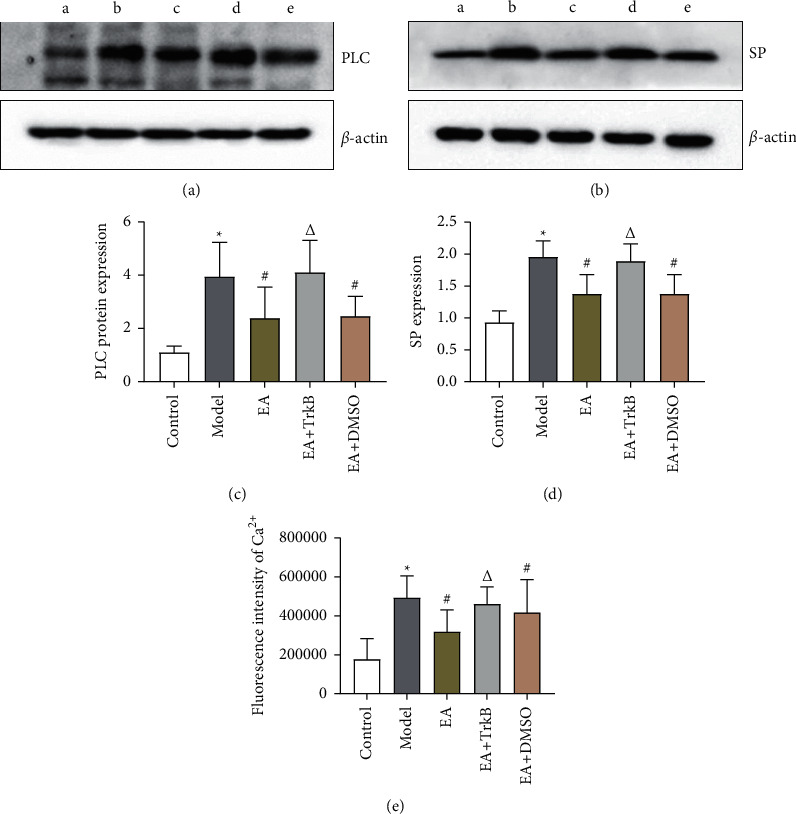
(a–d) The expression of PLC and SP in the colon of each group of rats (a: control group, b: Model group, c: EA group, d: EA + TrkB agonist group, and e: EA + DMSO group). (e) Mean fluorescence intensity of Ca2+ in the colon. ∗P < 0.01, versus the blank control group; #P < 0.05 and ΔP > 0.05, versus the model group.