
Figure 6.
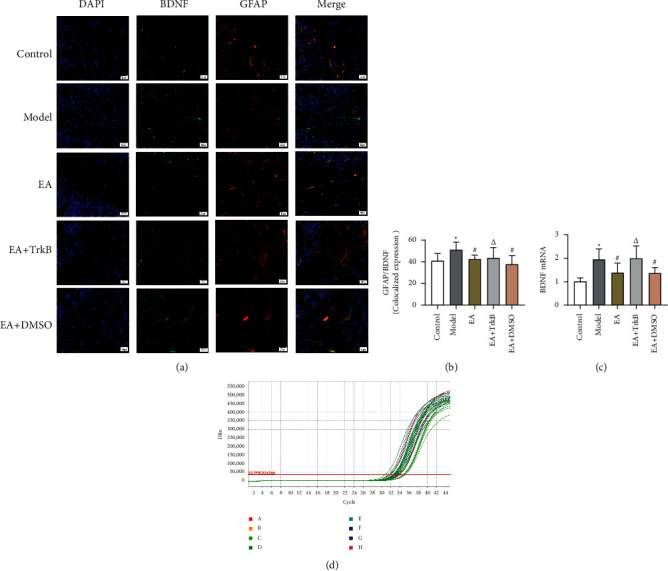
(a) GFAP and BDNF fluorescence in different groups. Green indicates BDNF, red indicates GFAP, and blue indicates DAPI-stained nucleus. (b) Colocalization of GFAP and BDNF. (c) mRNA expression of BDNF in the colon. ∗P < 0.05, versus the blank control group; #P < 0.05 and ΔP > 0.05, versus the Model group.