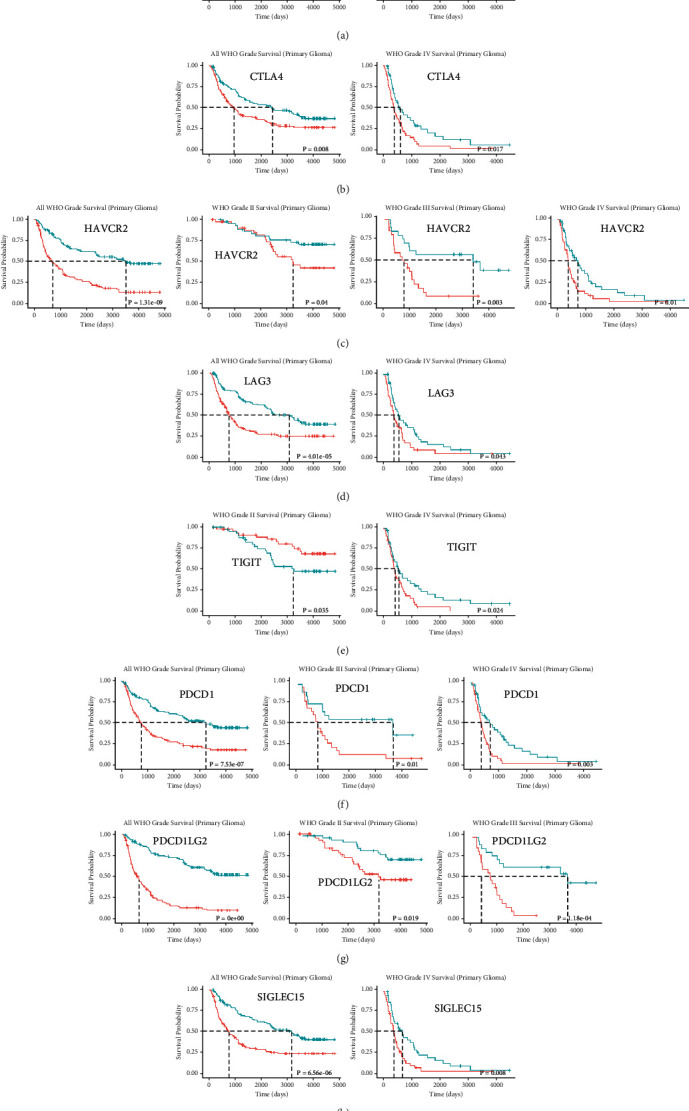
Figure 5.

Kaplan-Meier curves showing overall survival of glioma patients stratified into the high and low expression groups of each immune checkpoint gene. (a) The prognostic effect of CD274 expression in all WHO grades and WHO grade IV. (b) The prognostic effect of CTLA4 expression in all WHO grade and WHO grade IV. (c) The prognostic effect of HAVCR2 expression in all WHO grades, WHO grade II, WHO grade III and WHO grade IV. (d) The prognostic effect of LAG3 expression in all WHO grades and WHO grade IV. (e) The prognostic effect of TIGIT expression in WHO grade II and WHO grade IV. (f) The prognostic effect of PDCD1 expression in all WHO grades, WHO grade III, and WHO grade IV. (g) The prognostic effect of PDCD1LG2 expression in all WHO grades, WHO grade II, and WHO grade III. (h) The prognostic effect of SIGLEC15 expression in all WHO grades and WHO grade IV.
