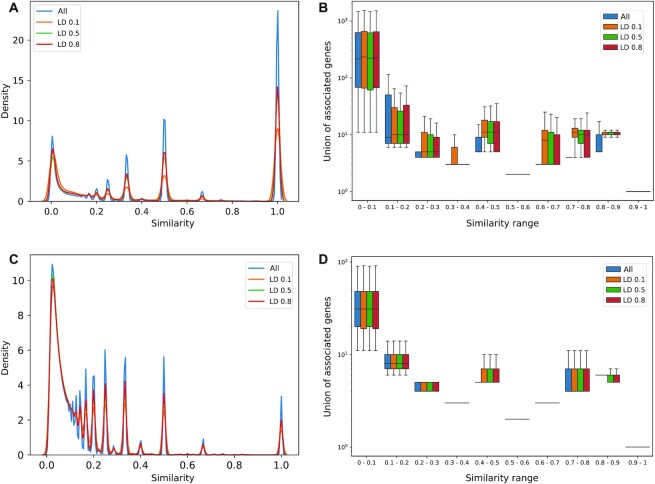
Figure 4.
Analysis of variants similarity networks. (A) Distribution of variants similarity values in the breast transcripts similarity network. (B) Cardinality of the union of associated transcripts for each interacting pair stratified by similarity range and LD filtering. (C) Same as (A) but with variants motifs similarity values. (D) Same as (B) but with variants motifs similarity values.

