Figure 5.
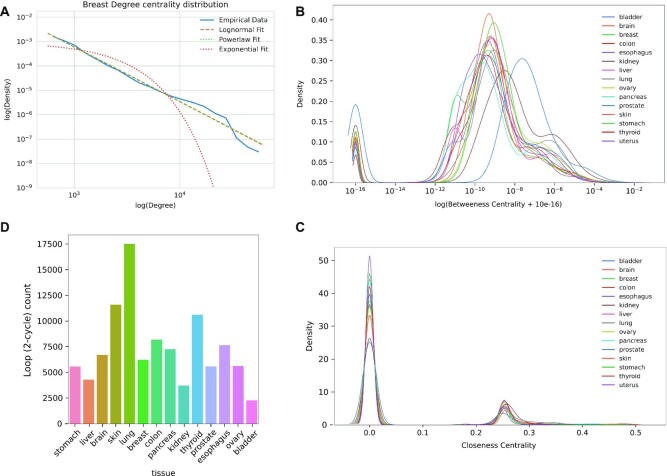
Analysis of variant–gene networks. (A) Log–log plot of the degree centrality distribution of the breast variant–gene network. (B) Betweenness centrality distribution of the variant–gene network across tissues. (C) Closeness centrality distribution of the variant–gene network across tissues. (D) Number of 2-cycles across tissues.

