Figure 4.
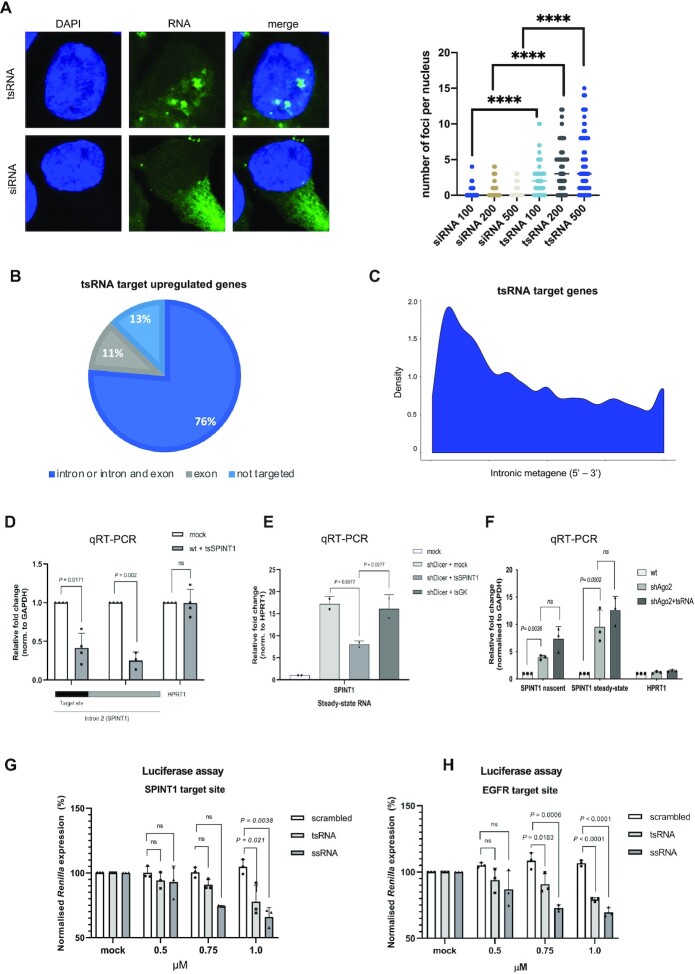
tsRNAs target introns for nascent RNA silencing. (A) (Left) Representative confocal images showing the localization of fluorescently labelled tsRNA and siRNA (in green) after transfection into BT549 cells. DAPI is in blue. (Right) Quantification of number of nuclear foci from confocal images. (B) Pie chart showing the proportion of upregulated genes that are targeted in intron or both intron and exon, targeted exclusively in exon and not targeted. (C) Metagene profile representing the distribution of predicted tsRNA target sites across the introns of target genes. (D) Bar charts showing the relative fold change of expression of the predicted tsSPINT1 (also tRF-3Gln-CTG) target site and the intronic site adjacent to it within intron 2 of SPINT1 (n = 3), measured by qRT-PCR, with HPRT1 as negative control. (E) Bar chart showing the fold change of steady-state expression of SPINT1 upon mock transfection and transfection of tsRNA against SPINT1, with transfection of tsRNA against GK as negative control. (F) Bar chart showing nascent and steady state SPINT1 RNA levels in wt, Ago2 KD and Ago2 KD transfected with tsRNA targeting SPINT1, with HPRT1 as negative control. (G) Bar chart showing the knockdown efficiency of SPINT1 intronic regions using the tsRNA, fully complementary (ssRNA) and scrambled sequences, plotted as a percentage (SD; *P = 0.019) of the normalized Renilla luciferase expression. The luciferase activity of the mock transfected cells was set as 100%. All tested 5′-phosphorylated ssRNA were transfected at 1 μM, 0.75 μM and 0.5 μM. Silencing activities were measured at 24 h post-transfection. (H) As in (G), using EGFR gene.

