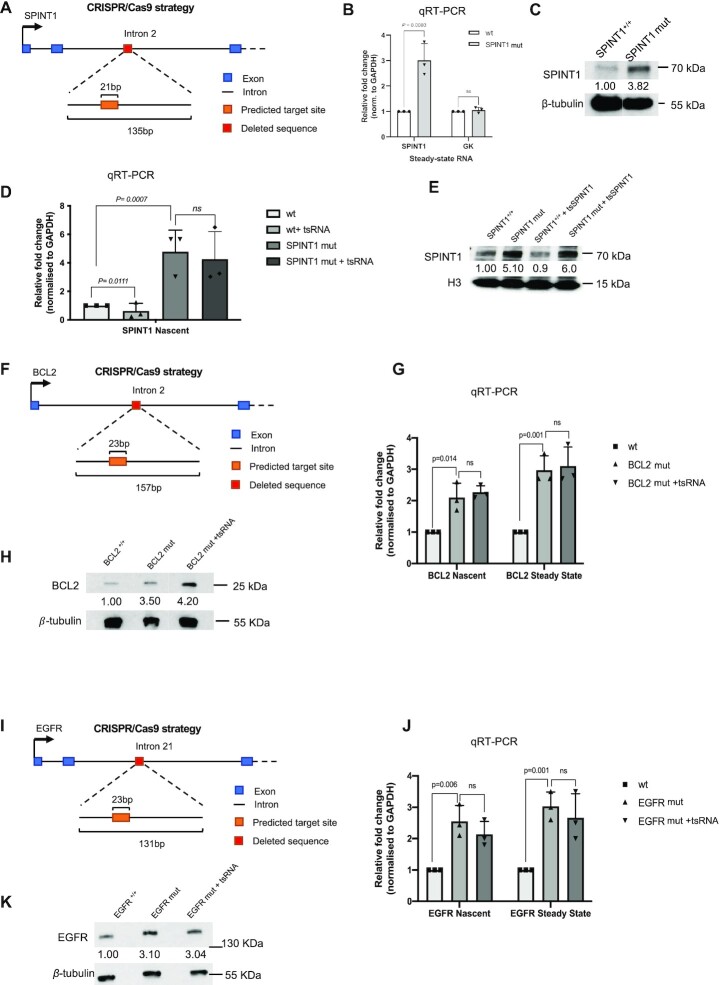
Figure 5.
Deletion of tsRNA target site leads to increased gene expression. (A) Diagram representing the CRISPR/Cas9 strategy for generating a mutant HEK293T-based cell line in which the predicted target site and its flanking sequence for SPINT1 in intron 2 is removed. (B) Bar chart showing the fold change of expression of steady state SPINT1 and GK transcripts, measured by qRT-PCR, in wild type, heterozygous SPINT1+/– and homozygous SPINT1–/– cells. (C) Western blot images showing signals of SPINT1 in wild type, and homozygous SPINT1mut cells with ß-tubulin as loading control. Numbers represent quantification of the SPINT1 signal normalized to ß-tubulin. (D) Bar chart showing the fold change of nascent expression of SPINT1 upon mock transfection and transfection of tsRNA against SPINT1 in wt and SPINT1mut cells. (E) Western blot images showing signals of SPINT1 in wild type, and homozygous SPINT1mut cells mock or tsRNA transfected of with H3 as loading control. Numbers represent quantification of the SPINT1 signal normalized to H3. (F) Diagram representing the CRISPR/Cas9 strategy for generating a mutant HEK293T-based cell line in which the predicted target site and its flanking sequence for BCL2 in intron 2 is removed. (G) Bar chart showing the fold change of nascent and steady state expression of BCL2 upon mock transfection and transfection of tsRNA against BCL2 in wt and BCL2mut cells. (H) Western blot images showing signals of BCL2 in wild type, and homozygous BCL2mut cells mock or tsRNA transfected of with ß-tubulin as loading control. Numbers represent quantification of the SPINT1 signal normalized to ß-tubulin. (I) As in F for EGFR in intron 21. (J) As in G for EGFR. (K) As in H for EGFR.

