Figure 6.
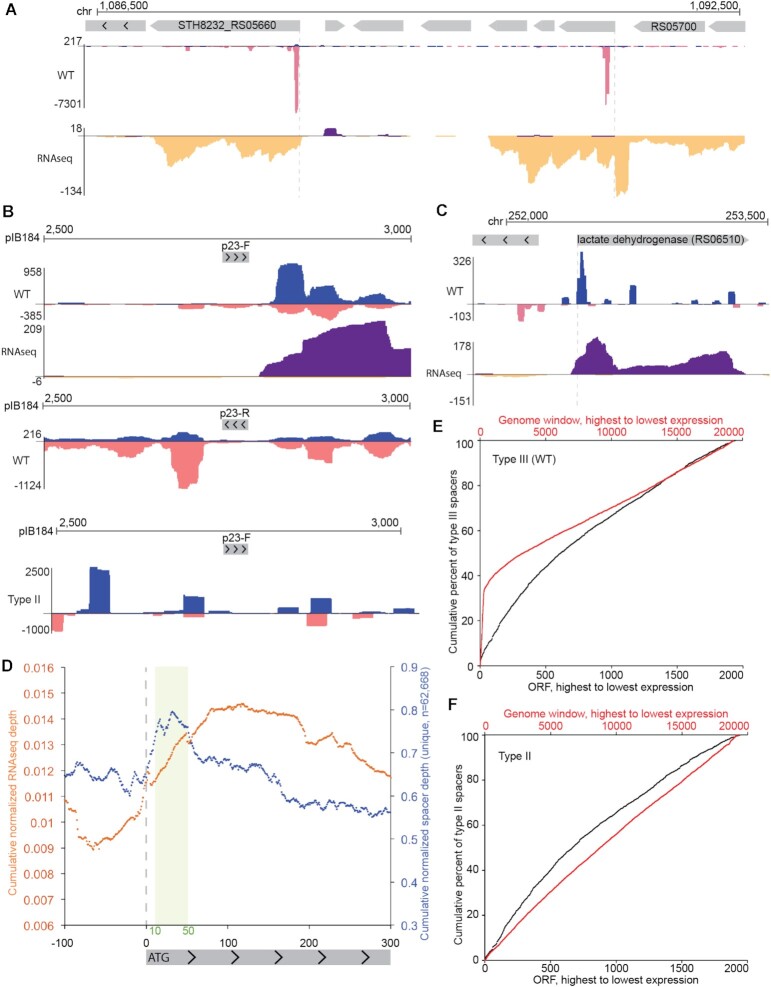
Type III-A spacer uptake patterns near gene promoters. (A and C) Genome browser tracks show cumulative spacer and RNAseq densities across two example genome regions with expressed genes. Spacers are shown in blue (top strand) and pink (bottom strand); RNAseq reads are shown in purple (top strand) and yellow (bottom strand). (B) Genome browser tracks show a high resolution view of type III spacer and RNAseq densities around the p23 promoter of plasmid pIB184 in either a forward orientation (top panel) or a reverse orientation (middle panel). For comparison, type II new spacers are shown in the bottom panel. (D) Meta-plot of cumulative spacer density (blue) and RNAseq density (yellow) across all annotated protein-coding genes in the Sth JIM8232 genome. (E-F) Cumulative capture of protospacers acquired by the type III-A system (E) and the type II-A system (F) is plotted in black across annotated, protein-coding Sth JIM8232 genes (ORFs) which have been sorted by expression levels. Genes are ranked by total RNAseq density, with the highest density genes on the left side of the plot. Cumulative capture of protospacers within 200 bp genome windows, rather than annotated protein-coding genes, is plotted in red. These windows were tiled across the entire genome and include ncRNA genes (like rRNAs and tRNAs) and intergenic space. Pooled data of at least three independent experiments are presented in (D–F).

