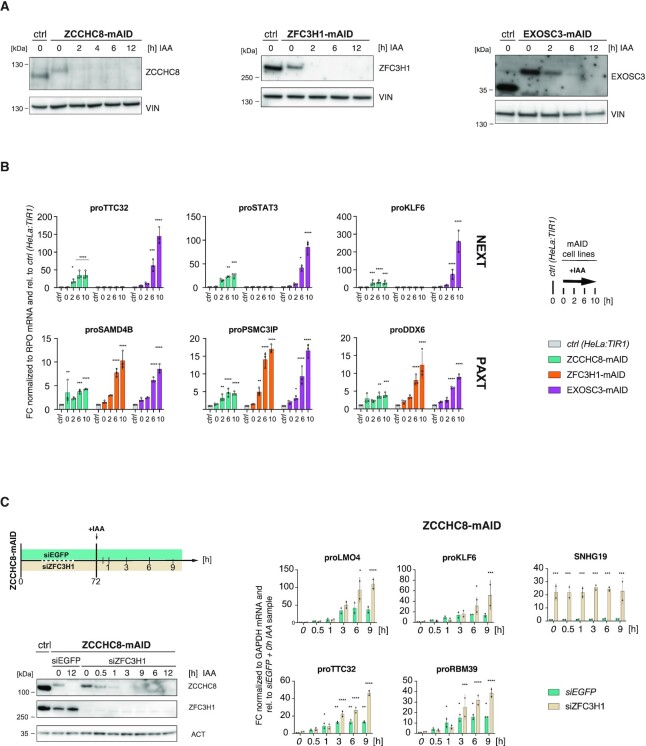
Figure 1.
A rapid depletion strategy provokes adaptor-specific substrate responses. (A) Western blotting analysis of unedited (ctrl) together with edited HeLa:TIR1 ZCCHC8-mAID (left panel), ZFC3H1-mAID (middle panel) and EXOSC3-mAID (right panel) cells. Degron-tagged cell lines were exposed to 750 μM IAA for the indicated time periods (h). Blots were probed with endogenous antibodies against ZCCHC8, ZFC3H1, EXOSC3 and vinculin (VIN) as a loading control. (B) RT-qPCR of total RNA analyzing three NEXT (top panel) and three PAXT (bottom panel) PROMPTs from depletion time course experiments analogous to (A). Values were normalized to Rplp0 (RPO) mRNA levels and plotted relative to results from unedited, non-IAA-treated HeLa:TIR1 (ctrl) cells (see italics). Columns represent average values of biological triplicate samples with error bars denoting standard deviations. Individual data are indicated as points. Significance of the difference between a given time point and the untreated control sample was determined by a two-way ANOVA test (*Padj ≤ 0.05, **Padj ≤ 0.01, ***Padj ≤ 0.001, ****Padj ≤ 0.0001, nonsignificant FC with Padj > 0.05 is not marked). (C) Western blotting (left panel) and RT-qPCR (right panel) analyses as in (A) and (B) but of ZCCHC8-mAID cells pretreated with siRNA against ZFC3H1 (siZFC3H1) or an siRNA control (siEGFP) and subjected to the indicated IAA time course (upper left schematics). Left panel: Actin (ACT) was used as a loading control. Right panel: Results are shown relative to the siEGFP + 0 h IAA sample (see italics) and normalized to GAPDH mRNA levels. Amplified regions include four NEXT PROMPTs (left) and, to confirm ZFC3H1 depletion, one PAXT target (SNHG19, right). Display and significance values as in (B), except that data were from biological duplicate samples.

