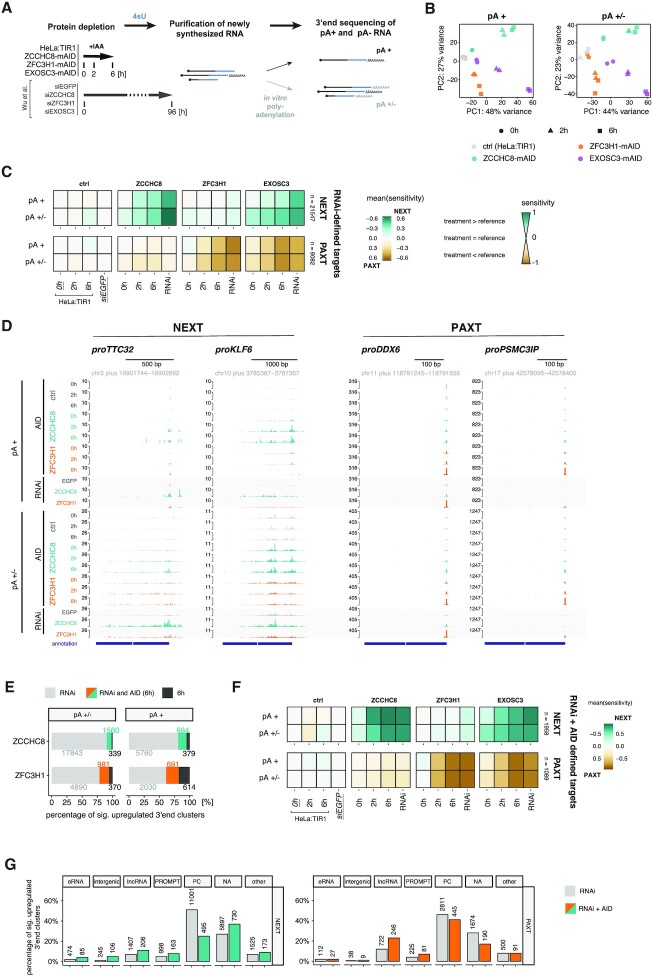
Figure 3.
AID-mediated depletion enables identification of direct targets of NEXT and PAXT. (A) Experimental workflow for 4sU RNA 3′ end sequencing sample preparation. Factor depletion was followed by 4sU addition and purification of 4sU-labeled RNA. An in vitro polyadenylation step, or absence thereof, enabled detection of both pA+ and pA− RNA species. Transcriptome changes upon AID-mediated protein depletions were compared to those from ‘RNAi’ datasets (26). (B) PCA of the generated pA+ and pA+/− 3′ end sequencing libraries from unedited HeLa:TIR1 (ctrl, gray), ZCCHC8-mAID (green), ZFC3H1-mAID (orange) and EXOSC3-mAID (purple) cells upon exposure to IAA for 0 h (circle), 2 h (triangle) or 6 h (square). PCA was computed with the top 2000 3′ end clusters ranked by variance across all samples. (C) Sensitivity of RNA 3′ end clusters within previously defined RNAi-based NEXT (upper panel) and PAXT (lower panel) targeting categories (26). Sensitivity values, ranging from −1 to 1, reflect the relationship between the 3′ end signal in the displayed samples relative to the respective reference sample (for AID: HeLa:TIR1, 0 h IAA; for RNAi: siEGFP). Positive values correspond to higher signal in the depletion than the reference sample, with signal exclusive to the depletion sample resulting in a sensitivity value of 1 (vice versa for negative values). Equal expression in depletion and reference corresponds to a sensitivity value of 0 (for details, see the ‘Materials and Methods’ section). (D) Genome browser views of selected NEXT (proTTC32, proKLF6) and PAXT (proDDX6, proPSMC3IP) target regions, visualizing 3′ end data from AID (0, 2 and 6 h) and RNAi depletion conditions. Upper and lower panels show pA+ and pA+/− libraries, respectively. Data from HeLa:TIR1/siEGFP ctrl, ZCCHC8 depletion and ZFC3H1 depletion samples are shown in gray, green and orange, respectively. Tracks are group scaled within pA+ and pA+/− libraries. (E) Intersection of upregulated (log2FC > 1, Padj < 0.1) pA+ and pA+/− 3′ end clusters upon 6 h IAA- or RNAi-mediated depletion of ZCCHC8 and ZFC3H1 relative to the respective reference sample (AID: 0 h IAA; RNAi: siEGFP; see Supplementary Figure S3A for a schematic overview of differential expression analysis). Absolute numbers are displayed next to the respective fraction. (F) Sensitivity maps as in (C) but showing mutually exclusive RNAi + AID NEXT and PAXT targeting classes based on the intersected ‘RNAi and AID (6 h)’ 3′ end clusters from (E). (G) Bar plots showing the percentage of 3′ end clusters within RNAi- and RNAi + AID-based NEXT and PAXT targeting classes that overlap with the indicated RNA biotypes. Respective absolute numbers of 3′ end clusters are included on top of the individual bars. PC: protein coding; NA: not annotated.

