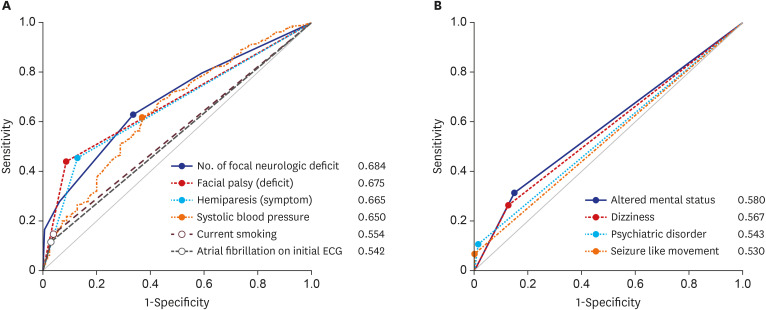
Fig. 3. ROC curve of the multivariate logistic regression model. (A) ROC curve analysis and AUC calculation for prediction of stroke in code stroke patients. (B) ROC curve analysis and AUC calculation for prediction of stroke mimics in code stroke patients.
ROC = receiver operating characteristic, AUC = area under the curve.

