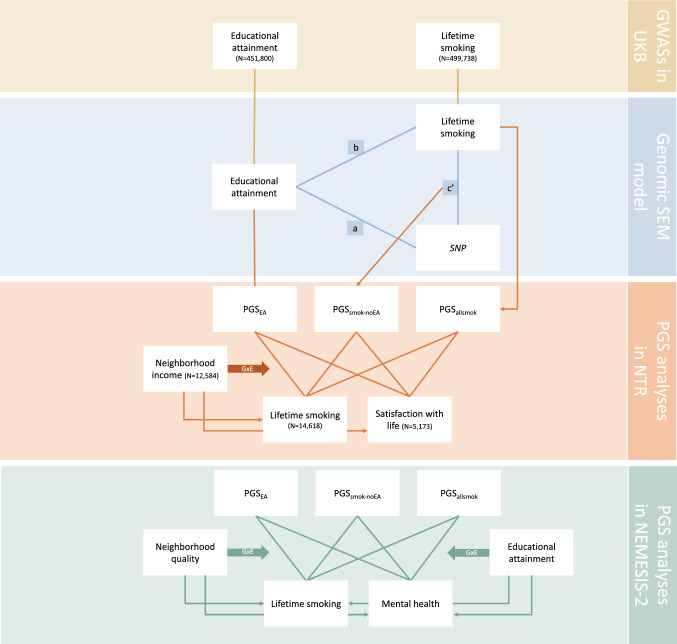
Fig. 1.
Flow-chart of the different analysis phases, with each phase in a different colour. In the Genomic SEM model, path (a) denotes the EA GWAS (direct SNP-EA associations), path (b) the smoking GWAS (direct SNP-smoking associations), and path (c’) the SNP-smoking association remaining after controlling for mediation through EA, capturing SNP effects on smoking-without-EA. In the NEMESIS-2 sample we used multiple imputation, such that N was constant (N = 3090) for all analyses. PGS PolyGenic Score, EA educational attainment, PGSEA PGS for EA, PGSsmok-noEA PGS for smoking-without-EA, PGSallsmk PGS for lifetime smoking (Color figure online)

