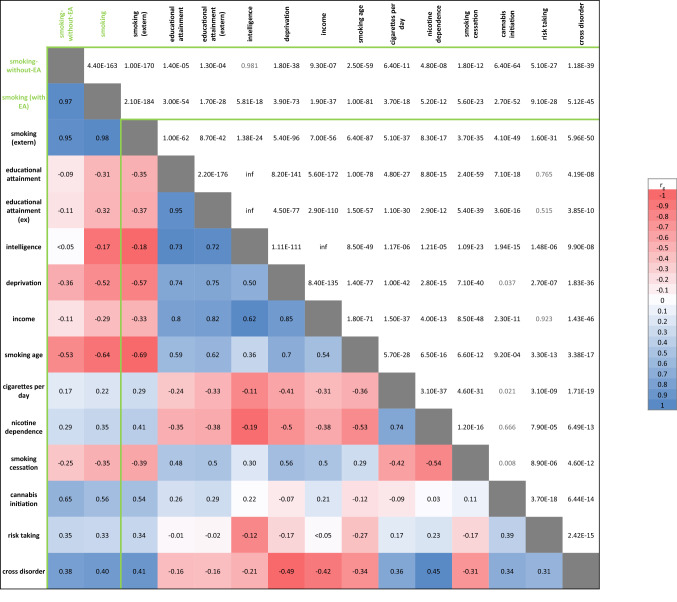
Fig. 3.
Heat map of genetic correlations between the smoking-without-EA GWAS and SES- and smoking related traits. Below the diagonal are the correlation estimates, with colors indicating the direction (red = negative; blue = positive) and strength (dark = strong; light = weak) of the association. Above the diagonal corresponding p-values are reported, with in grey those that were not significant after correcting for multiple testing with 15 traits (p = 0.05/15 = 0.002). Trait description and sources can be found in Supplementary Table S8 (note: deprivation and income summary statistics were derived from our own GWAS analysis of the UK-Biobank sample) (EA educational attainment, extern same trait but from independent GWAS source, inf infinitesimal) (Color figure online)

