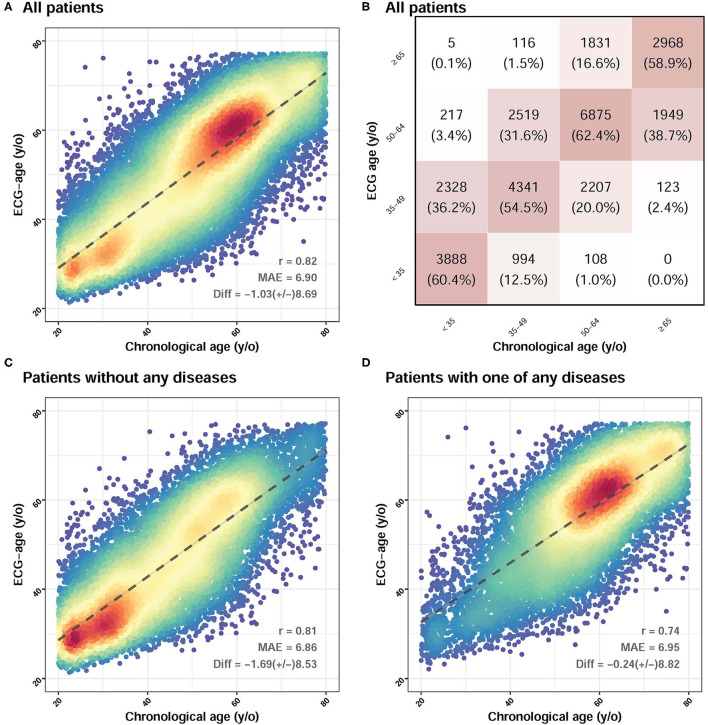
Figure 3.
The association between chronological age and ECG-age in validation set. (A) Shown is the ECG age (y-axis) vs. the reported chronologic age (in years; x-axis, dotted line). The difference between chronologic age and ECG-age was 1.03 ± 8.69 years with a mean absolute error of 6.899 years. (B) It demonstrates a multi-group classification to the age (in years). There are 16 groups which divided by ECG age and chronologic age. The y-axis is ECG age and the x-axis is chronologic age. Each group is in terms of the percentage of patients with a specific chronologic age who had a specific corresponding ECG-age (eg, a patient from <35 y of age having a ECG age from <35 y). The squared weighted kappa value was 0.76 in this analysis. (C) Shown a subgroup analysis about patient without any diseases. The difference between chronologic age and ECG-age was 1.69 ± 8.53 years with a mean absolute error of 6.86 years. (D) Shown a subgroup analysis about patient with one of any diseases. The difference between chronologic age and ECG-age was 0.24 ± 8.82 years with a mean absolute error of 6.95 years. The MAE is highest in patient with any one of disease.

