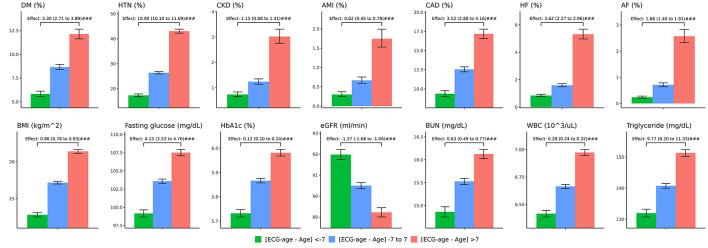
Figure 4.
The comparison between higher ECG-age and lower ECG-age for outcomes of interest in validation set. The plots display three groups, with ECG-age more than 7 years greater than the chronological age (denoted by: ECG-age –Age >7, red columnar) those with ECG-age within a range of 7 years from their chronological age (denoted by: ECG-age –Age-7 to 7, blue columnar); and, those with ECG-age more than 7 years smaller than the chronological age (denoted by: ECG-age –Age <7, green columnar). X-axis is cumulative incidence and y axis is year. We can find red columnar is obvious with high hazard ratio on all outcomes of interest with statistics significant. Green columnar demonstrated opposite effect on all outcomes of interest.

