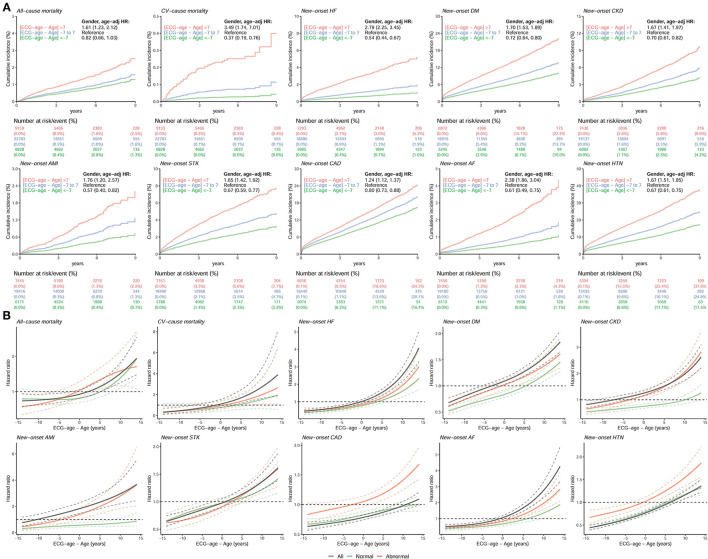
Figure 7.
The comparison between higher ECG-age and lower ECG-age for outcomes of interest in validation set. (A) Long-term incidence of developing corresponding adverse event in patients at risk, stratified by the difference between chronological age and ECG-age. The table shows the at-risk population and cumulative risk for the given time intervals in each risk stratification. (B) Continuous association of the difference between chronological age and ECG-age on each outcome. The solid line and dashed line are the point estimation and the corresponding 95% conference interval, respectively. All hazard ratios were adjusted by gender and chronological age. “Normal” refers to the ECGs labeled as normal by the original interpreting physician at the time of ECG acquisition, “abnormal” refers to any ECGs not identified as normal. The black line, green line, and red line represent the risk curve in all ECGs, normal ECGs, and abnormal ECGs, respectively.

