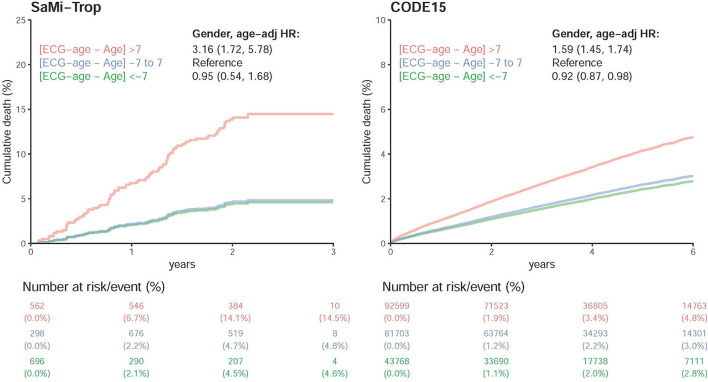
Figure 9.
Survival analysis in SaMi-Trop and CODE15 datasets. Cox proportional model for each risk stratification on all-cause mortality in SaMi-Trop and CODE15 datasets. The table shows the at-risk population and cumulative risk for the given time intervals in each risk stratification. Both of the patients are taken into consideration: those with ECG-age more than 7 years greater than the chronological age (denoted by: “>7 years older”); those with ECG-age within a range of 7 years from their chronological age (denoted by: “±7 years”); and, those with ECG-age more than 7 years smaller than the chronological age (denoted by: “>7 years younger”).

