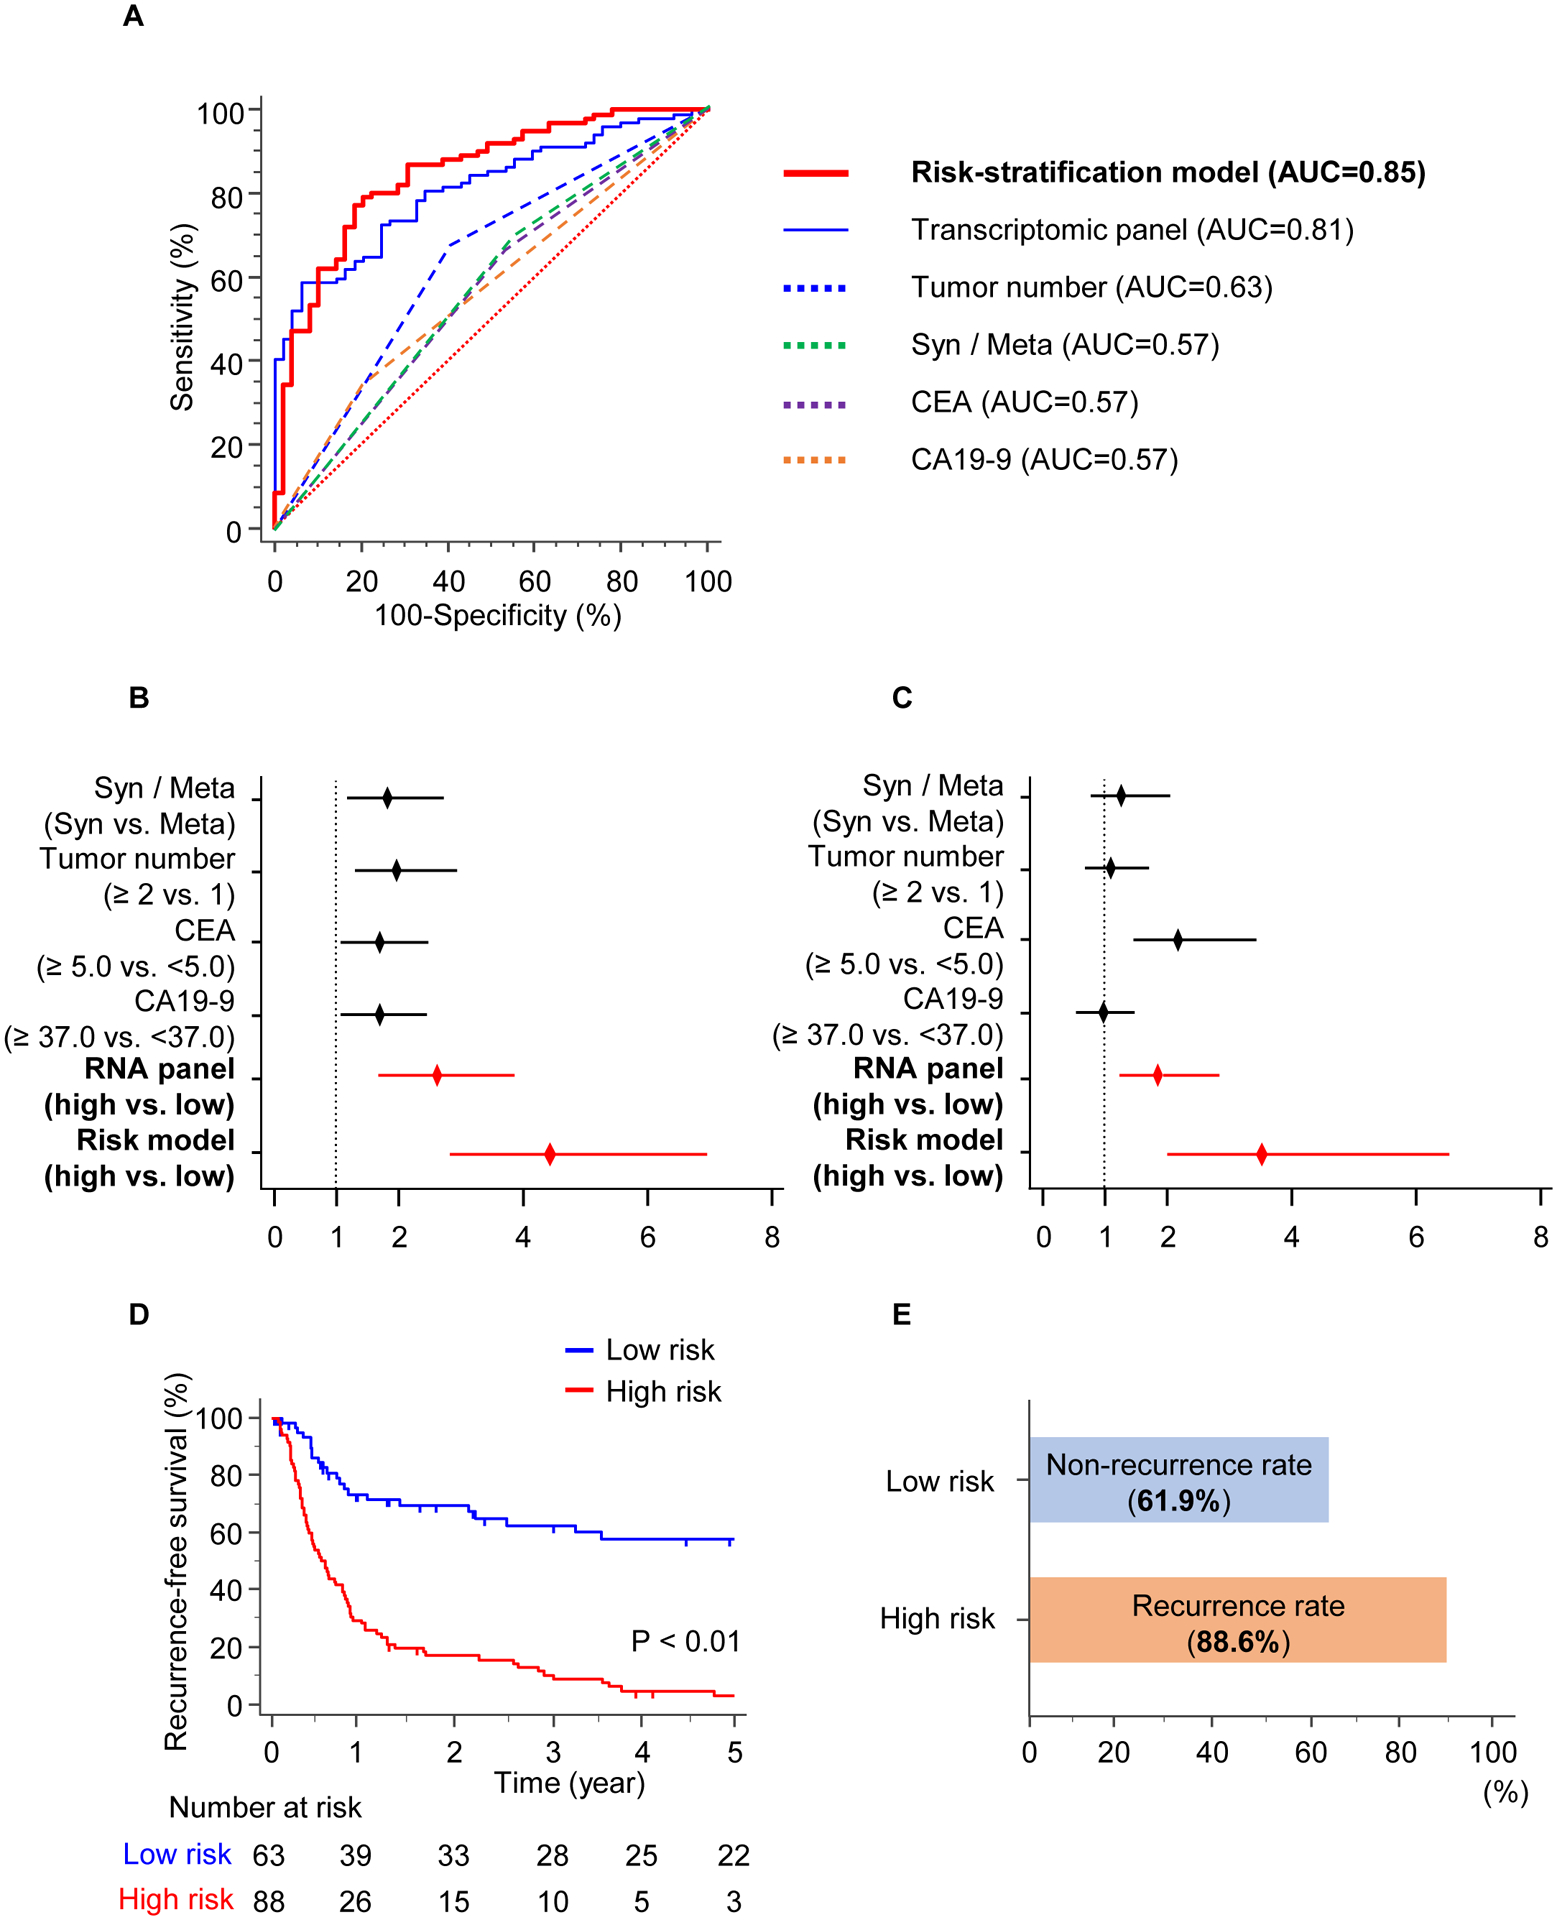
Figure 3.

The risk-stratification model in the validation cohort. A) ROC curves for the model by combining the panel and clinical factors, vs. the transcriptomic panel or indicated risk factors in the validation cohort. B–C) Forest plot showing HRs of indicated clinicopathological factors, the panel, and the stratification model in univariate (B) and multivariate (C) analysis. D) RFS between high- (Red) and low- (Blue) risk groups by the risk-stratification model. E) Bar graphs shows 61.9% of low-risk patients with CRLM who would have experienced non-recurrence, and 88.6% of high-risk patients with CRLM who would have experienced recurrence.
