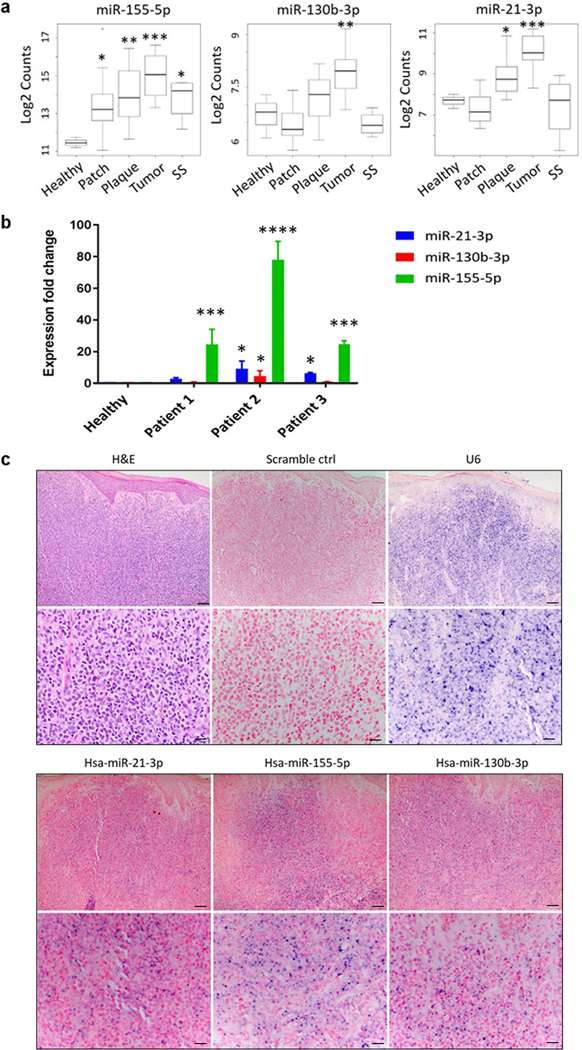
Figure 1.
Analysis of miR-155, -130, and -21 expression in lesional skin samples from CTCL patients. A. Expression levels of miR- 155, miR- 130, and - 21 in normal tissue, early or patch/plaque (T1, T2), tumor (T3), and erythrodermic (T4) MF/SS stages (n = 48). p- values were measured by Mann–Whitney independent t test. *p < 0.05, **p < 0.01, ***p < 0.001. B. qRT-PCR measurements of miR- 155, - 130, and - 21 expression in human lesional skin from 3 patients with CTCL were normalized to the relative expression in healthy T-cells (U6 was used as endogenous controls to normalize the miRNAs expression in CTCL tissues) and presented as mean ± SD. *p < 0.05, ***p < 0.001, ****p < 0.0001 by two-tailed Student’s t test. C. Representative H&E images and in situ hybridization images of miR- 155, miR- 130, and - 21 or scrambled (control) probes in sections of CTCL tumor lesion. The pictures were taken using optical microscope and imaging system. Upper image, scale bar = 100 μm; lower image, scale bar = 20 μm.

