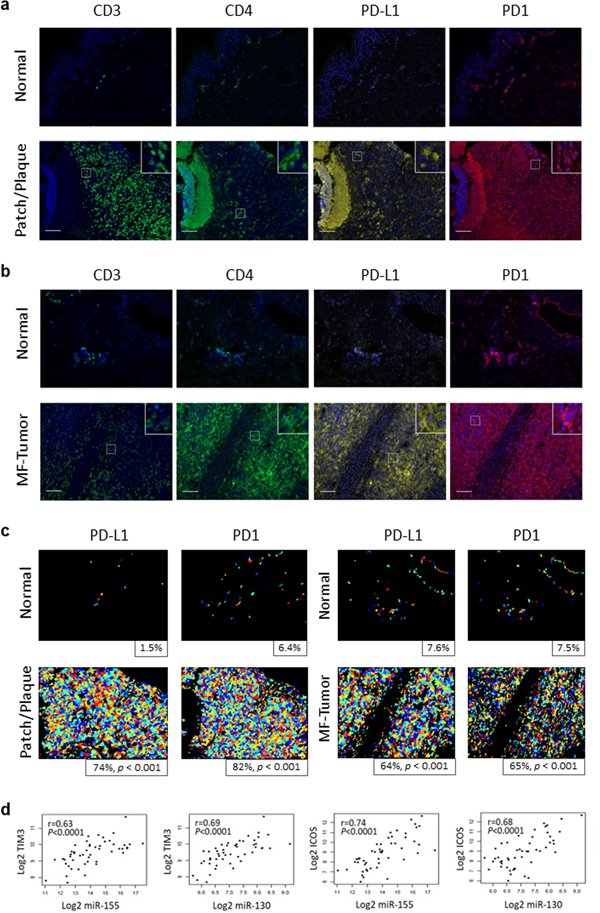
Figure 2.
IC protein expression and the correlation between IC gene and miR-155, -130, -21 expression in CTCL. A-B. Immunophenotypic features of CTCL patch/plaque or tumor, with multiplex immunohistochemistry for IC expression. CD3, CD4, PD1, and PD-L1 expression on skin sections of CTCL lesion from a representative patient with patch/plaques (A) or tumor (B) are shown. Scale bar = 100 μm. C. Automated scoring of PD-L1 and PD1 staining for patch/plaque and tumor stage lesions and matched healthy controls. Positive cells are displayed in varying colors, and percentages of positive cells are shown. P-values are for Pearson’s chi-squared test of equal proportions between controls and patient samples. D. Pearson correlation scatter plots of miR-155, -130, -21 levels and PD1, PD-L1, CTLA-4, LAG3, TIM3, ICOS gene expression. p values were two-sided, and the statistical significance threshold was set at p < 0.05.

