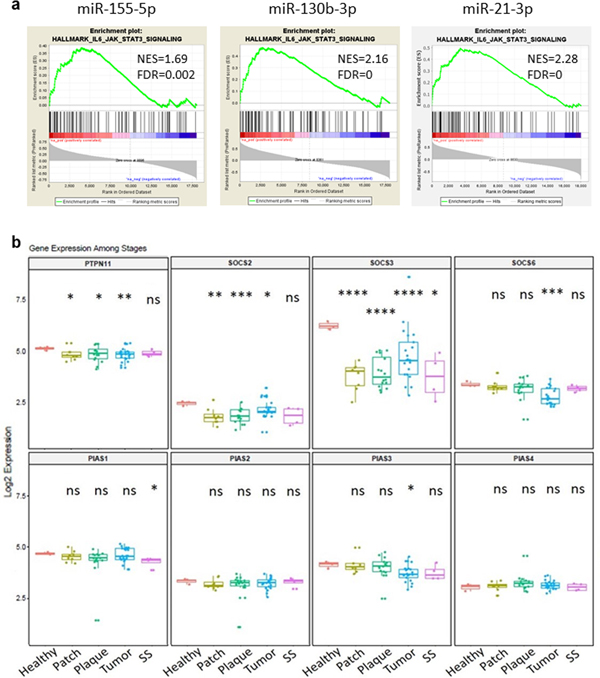
Figure 3.
Enrichment of miR-155, -130 and -21 in IL6/JAK/STAT3 signaling pathway and the expression of JAK/STAT signaling negative regulators. A. Enrichment plots from gene set enrichment analysis (GSEA). B. Expression level of the JAK/STAT signaling negative regulators: SOCSs, PIASs and PTPNs at different stage. *p < 0.05, **p < 0.01, ***p < 0.001, ****p < 0.0001. Each T- stage compared to normal control by two-tailed Student’s t test.

