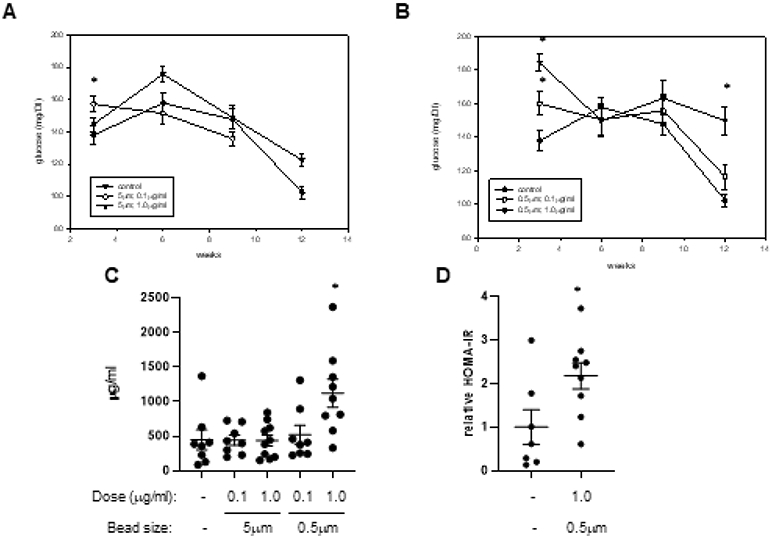
Figure 3. Plasma glucose and insulin.

Fasting plasma glucose levels were obtained from mice drinking normal water (control) and that containing 5μm PS beads (A) or 0.5μm PS beads (B) at the indicted concentration after 3, 6, 9, and 12 weeks of consumption. Fasting plasma insulin levels were measured in samples collected from the 5 treatment groups at termination (C). Also illustrated are calculated HOMA-IR scores obtained from control mice and those mice ingesting 0.5μm beads at a dose of 1μg/ml for 12 weeks (D). *: p<0.05
