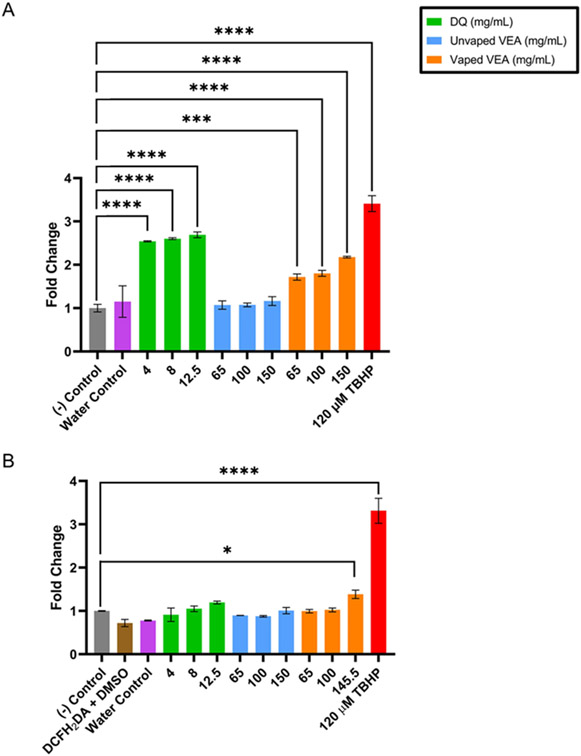
Figure 2.
ROS generated at 75 minutes by unvaped VEA, VEA vaping emissions, DQ standard, and DMSO, water and TBHP positive controls in (A) acellular and (B) cellular systems. Results were normalized to their cytotoxicity and are expressed as fold change in fluorescence intensity over the untreated control in the acellular or cellular system. Each treatment is expressed as the mean ± SEM (n=3) for both acellular and cellular assays. Two-way ANOVA was used to determine statistical significance compared to the negative control. * indicates p < 0.05; *** indicates p < 0.001; **** indicates p < 0.0001.

