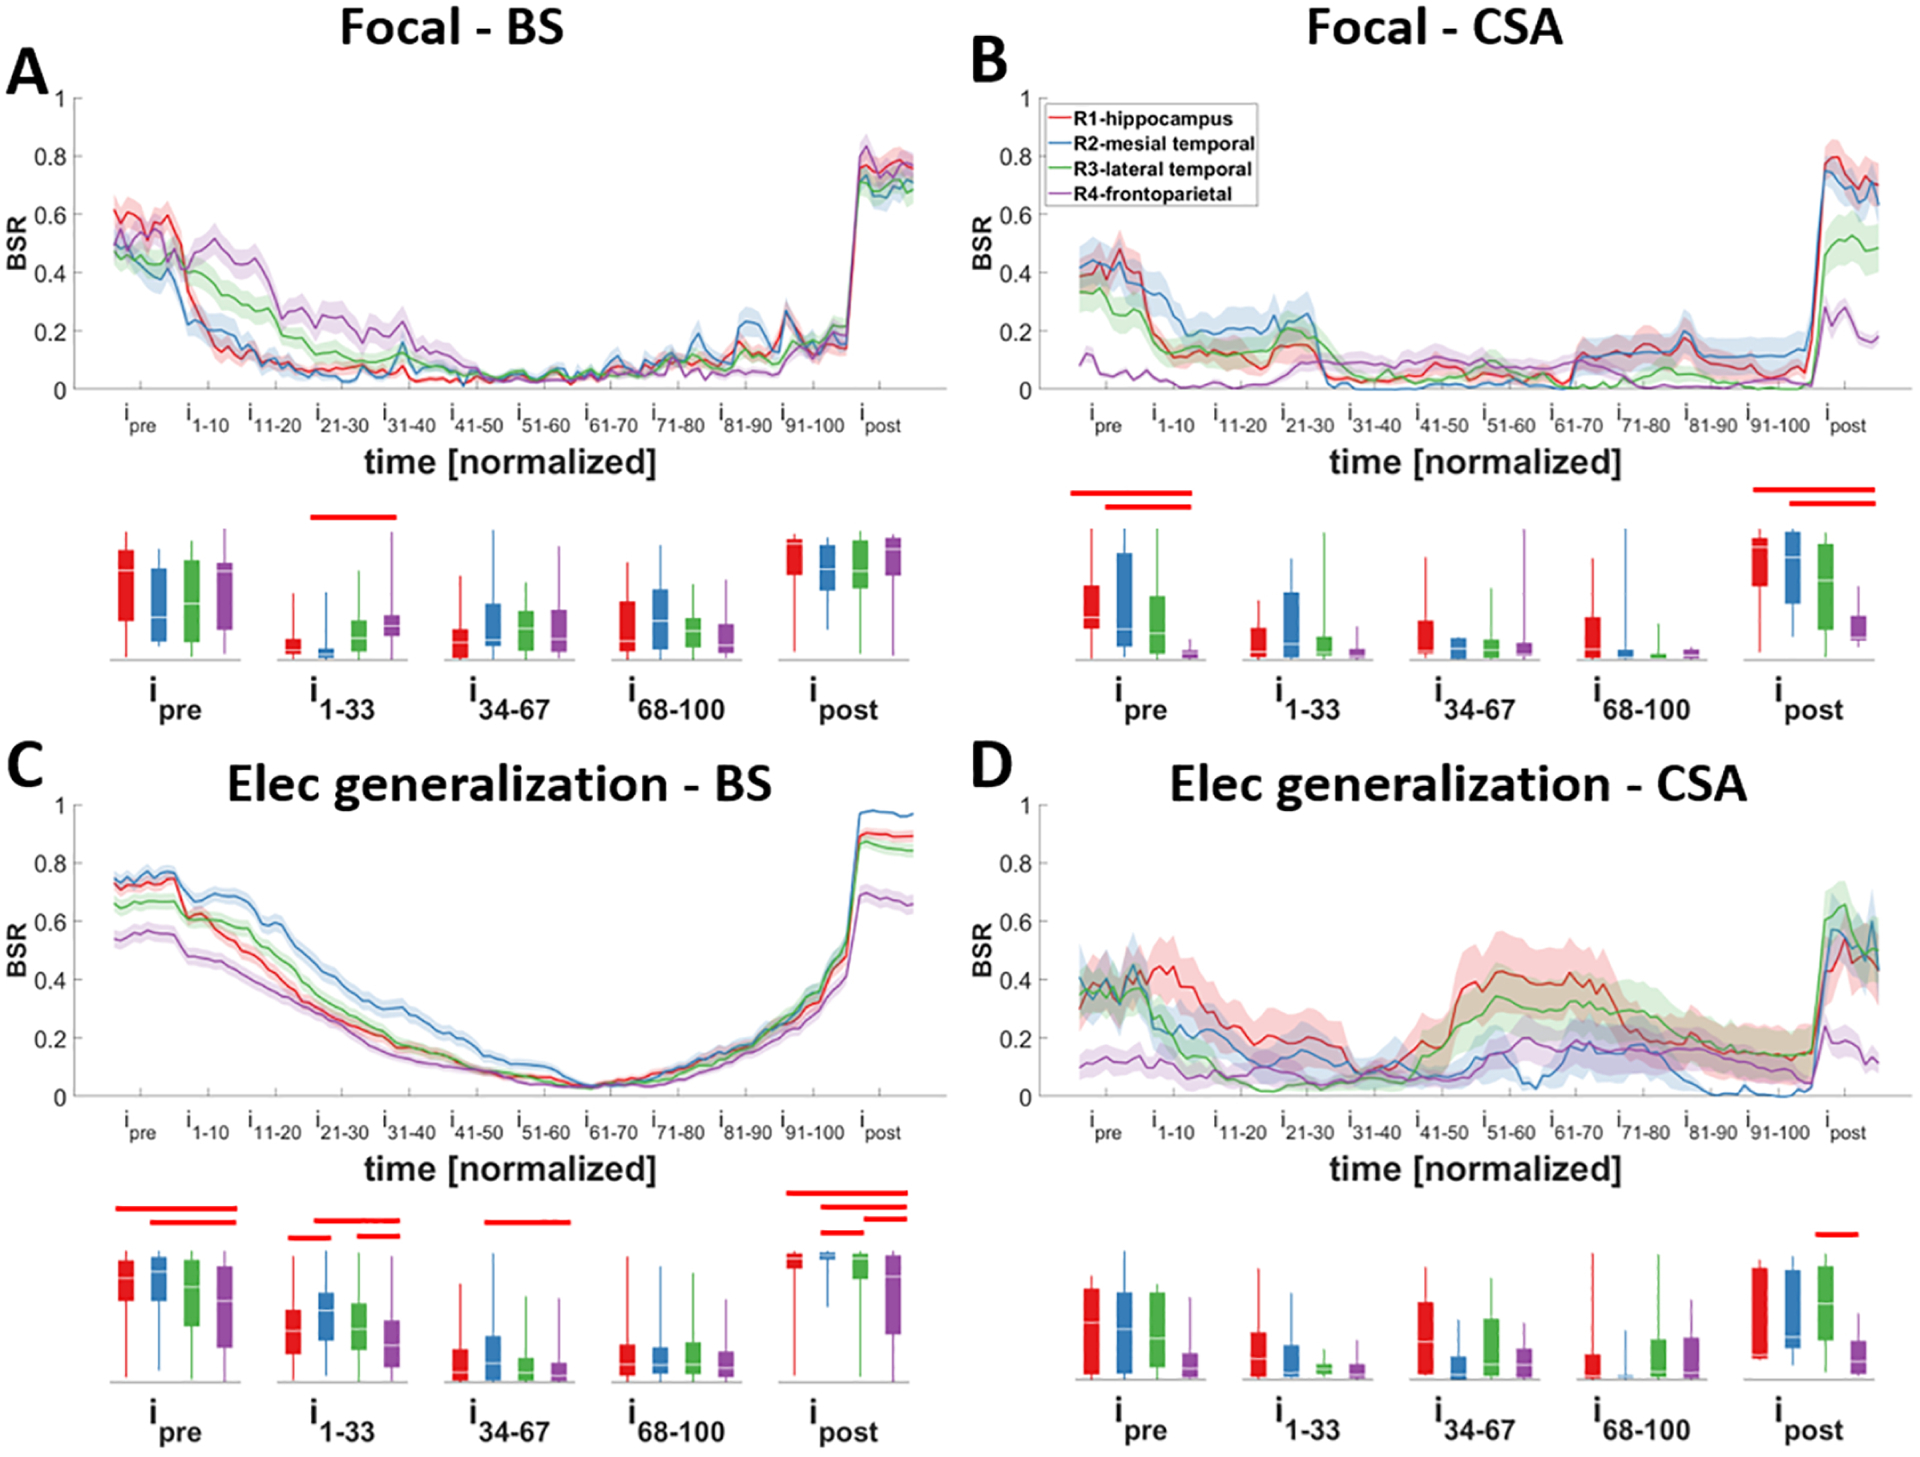
Figure 5. Changes in the burst suppression ratio (BSR) of different regions during different seizure types.

Seizures were classified into different groups based on their focality: A and B) focal; C and D) with electrographic generalization, and the bursting pattern at their termination: A and C) asynchronous burst suppression (aBS) and synchronous burst suppression (sBS); B and D) continuous seizure activity (CSA). Note that most regions behave similarly except for frontoparietal regions. Except for focal-BS seizures, before the seizure starts and after the seizure ends, frontoparietal regions show more bursting activity (and less suppression) especially compared to hippocampus (B, C). Traces indicate averages with a spread of plus/minus one standard error (shaded area). The box-and-whisker plots underneath the traces indicate summarized measure (BSR) within different time periods. Horizontal bars indicate significance between the pairs (p<0.05; i: interval).
