Figure 2.

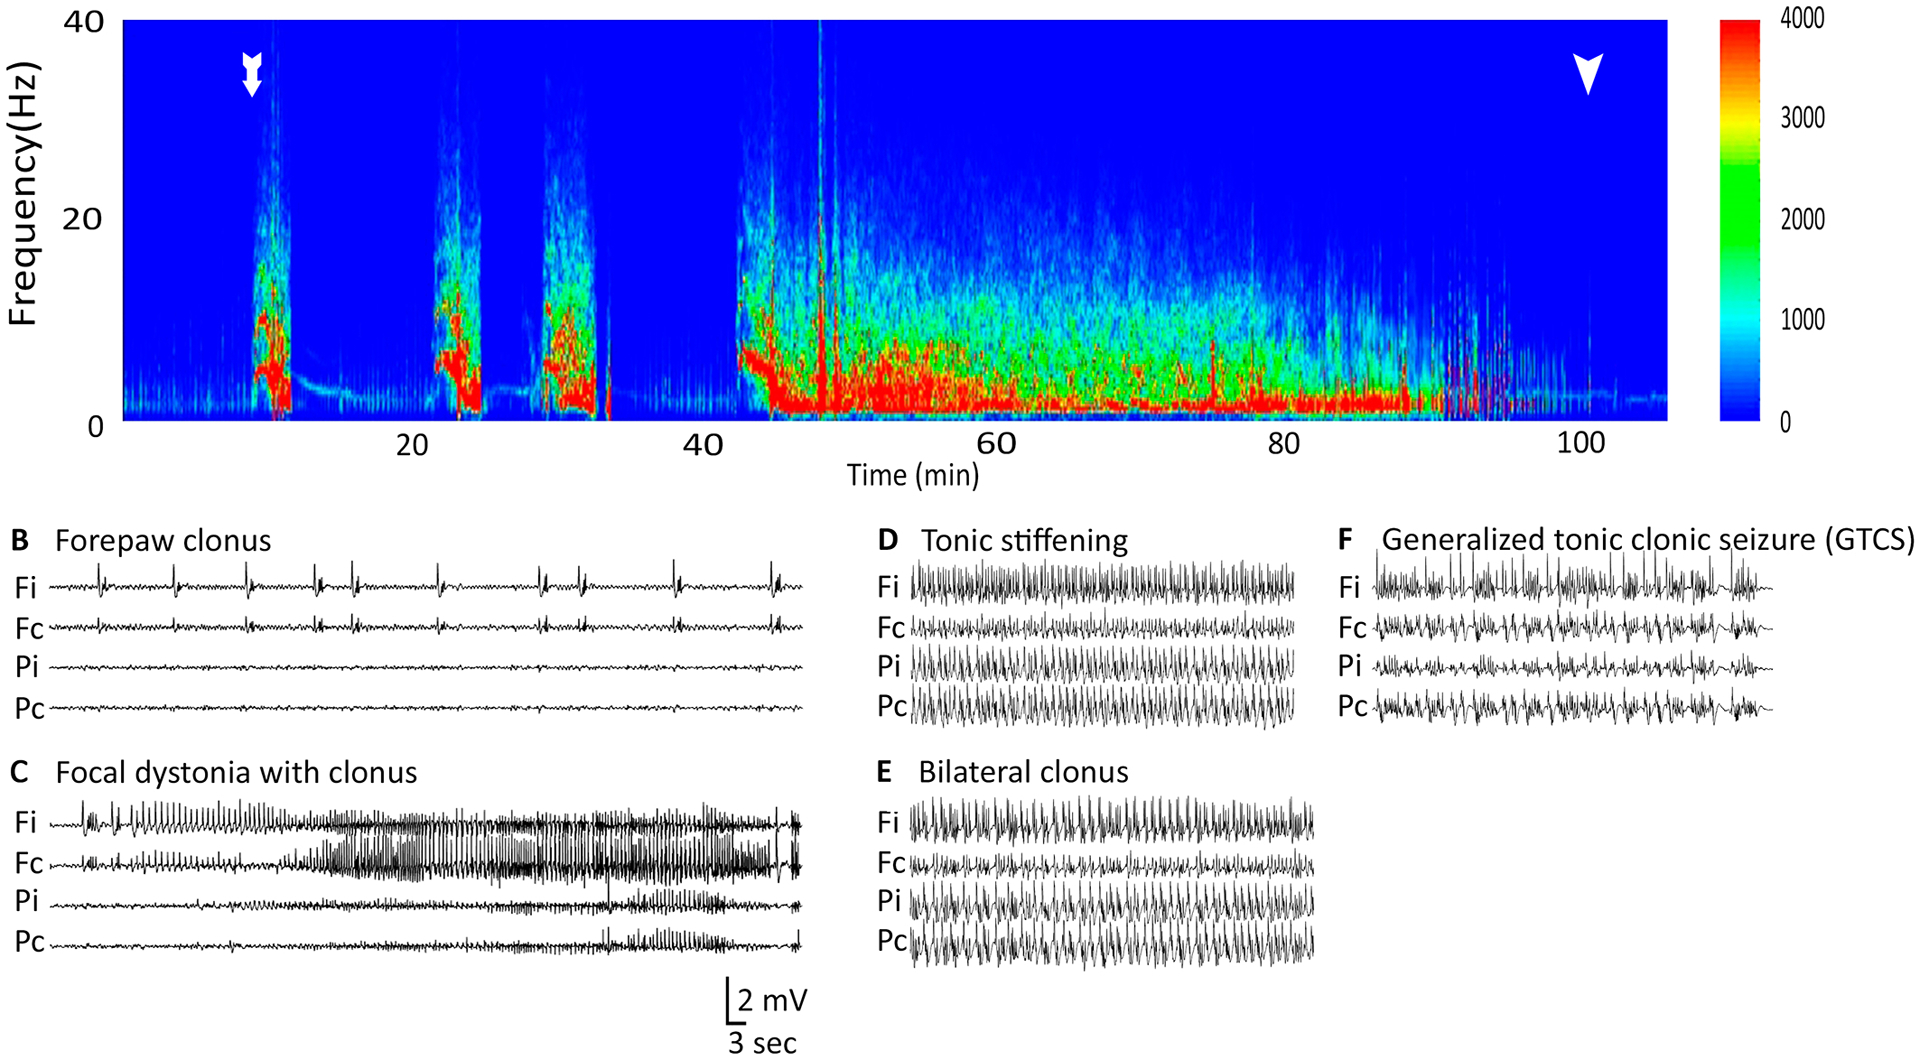
This figure shows that power spectrogram and corresponding EEG traces observed during early focal intermittent seizures, continuous generalized convulsive seizures and final coma phase during Co-homocysteine-induced SE. The EEG electrodes were placed in four cortical locations - frontal ipsilateral (Fi), frontal contralateral (Fc), parietal ipsilateral (Pi), and parietal contralateral (Pc). (A) The total power of EEG recorded at Fi was plotted against time. Time t=0 corresponds the instant of homocysteine injection. The onset of first focal seizure is shown with a white arrow. Each focal seizure was followed by baseline EEG trace. The generalized seizure started around 42 mins from the homocysteine injection and continued for a long time (~50 mins). The end of the late stage is shown with another white arrow. (B-C) EEG traces correspond to two behavioral patterns during the early phase. Please note the changes in EEG recorded at the frontal electrodes between B and C. (D-E) EEG traces corresponding to tonic stiffening and bilateral clonus during the late phase. (F) EEG traces associated with generalized tonic clonic seizures. (G) Pie chart showing the proportion of seizures with distinct behavioral patterns observed in our experiments.
