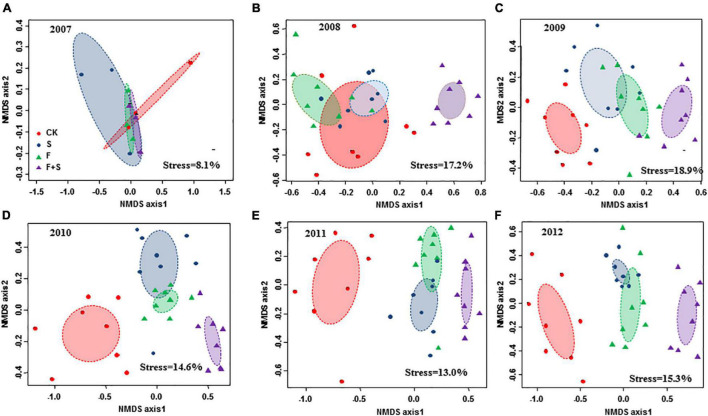
FIGURE 2.
Nonmetric multidimensional scaling (NMDS) patterns of community dissimilarities among treatments using each quadrat data (n = 8) of plant species composition along the temporal scale (A: 2007; B: 2008; C: 2009; D: 2010; E: 2011; F: 2012). Ellipses with different colors indicate 95% CI ellipses for centroids of the control (CK, red color), fertilization (F, green color), shade (S, blue color), and interaction with fertilization and shade (F+S, purple color). It is noted that quadrat data of 2007 (n = 3) were calculated using the baseline surveys prior to treatments (refer to the section “Materials and Methods” for more details).

