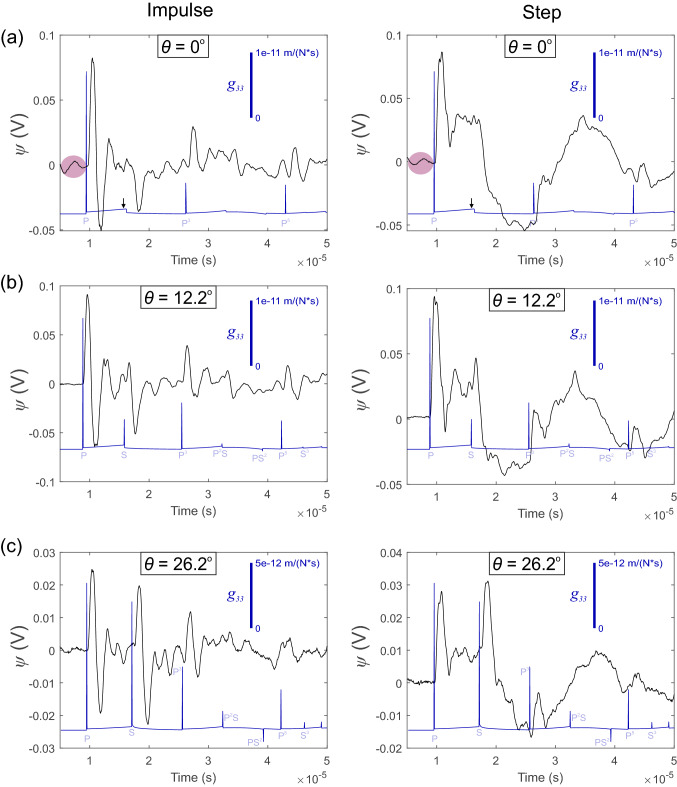
Fig. 5.
Example of the waveforms recorded on PZT receivers at a = 0, b = 12.2, and c = 26.2, for the impulsive (left panels) and step-like source (right panels). Signals were recorded at 20 dB gain. The waveforms are the result of stacking and averaging 50 traces (black line). Using the generalized ray theory [16], the true Green’s functions are given along with the theoretical wave arrivals including reflections (blue line). The purple regions in a emphasize the cross-talk from the HVP in the system at the lowest source–receiver distance

