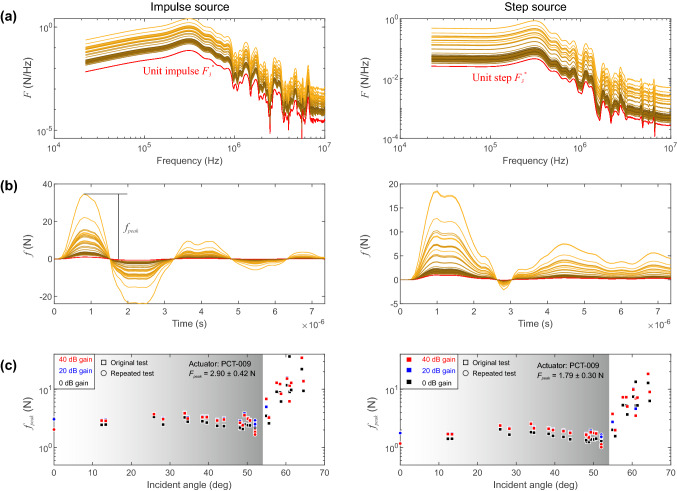
Fig. 9.
a Unit force–time spectra (red line) and corrected spectra (colored lines) for the impulsive (left panels) and step sources (right panels). Light and dark traces indicate higher and lower incident angles, respectively. b Reconstructed force–time function using the inverse Fourier transform [3]. c Comparison of the maximum force with respect to the incident angle (). The test were repeated using five additional sensors (circle markers) and found that the methods employed are repeatable

