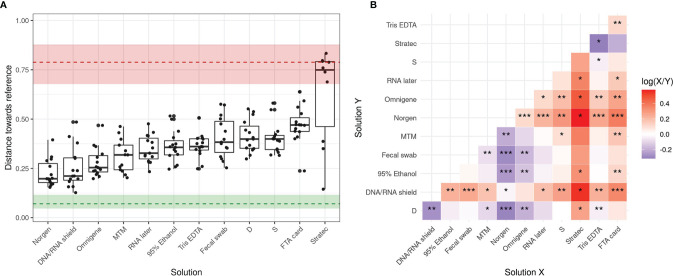
Figure 4.
Summary of community shifts in response to stabilizing solutions over a 14-day storage period. (A) Bray-Curtis distance towards the reference for each patient grouped by stabilizing solution. Median and 5th-to-95th percentile ranges are shown for both interaliquot and interpatient variability. (B) A pairwise paired Wilcoxon test was performed to compare solutions with each other, the color code refers to the log10 fold change of the median performance across patients: blue if the solution on X axis performs better, red if the solution on Y axis performs better. Significance is shown as follows: (*) indicates fdr<0.05, (**) indicates fdr<0.01, (***) indicates fdr<0.001.

