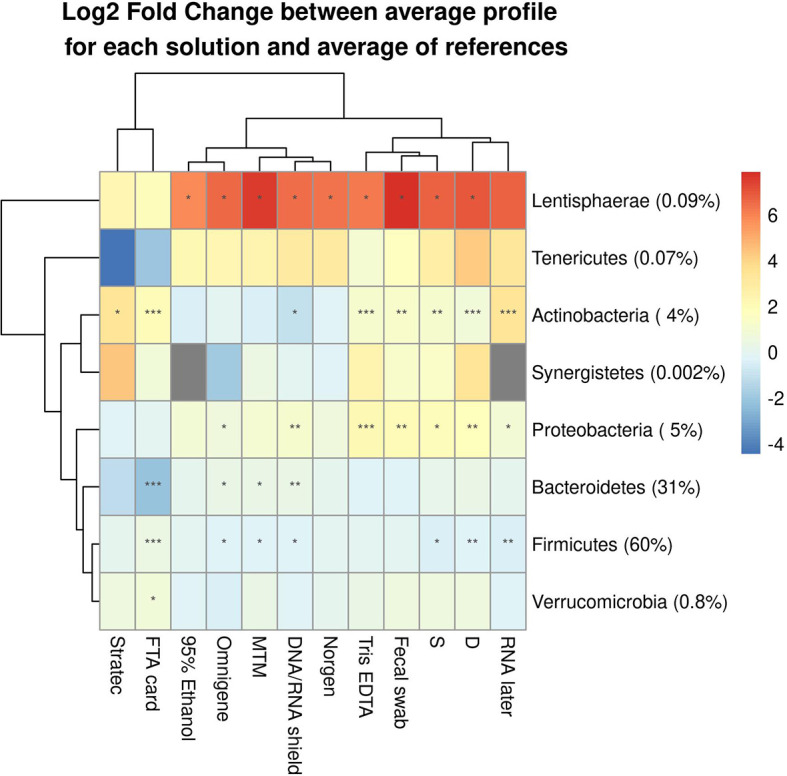
Figure 5.

Differentially abundant bacterial phyla between samples and their references among the 10 tested DNA stabilizing solutions. The median log2-fold change of average profiles is shown with the significance according the corresponding paired Wilcoxon test. (*) indicates fdr<0.05, (**) indicates fdr<0.01, (***) indicates fdr<0.001.
