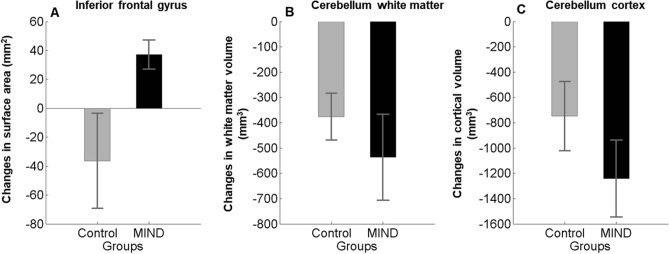
Figure 5.
Time × group interaction for gray and white matter volumes of brain regions in the MIND diet group (black color) compared with the control group (gray color). Changes (mean and standard error of the mean) presented. Results showed that MIND diet intervention significantly increased mean changes in the surface area of the inferior frontal gyrus (A) in comparison with the control group. The differences in cerebellum white matter (B) and cortex (C) in both groups are decreasing but not significant.

