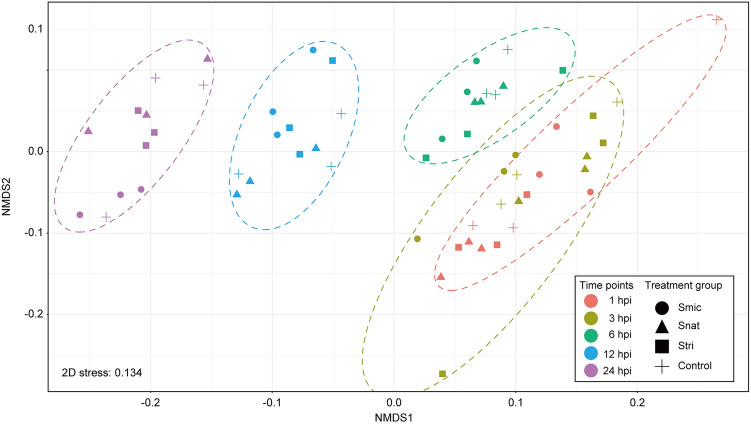
Figure 1.
Non-metric multidimensional scaling (NMDS) of RNA-seq samples based on expression levels of Acropora tenuis genes. Gene expression levels among all samples were normalized using the trimmed mean of M values method, and then converted to CPM. A total of 5340 genes for which expression levels (TMM-normalized CPM) were larger than 10 in all samples were used with the “metaMDS” of the vegan package73. 2D stress was 0.134. Ellipses (dotted line) are drawn around each time point using “geom_mark_ellipse” of the ggplot package74. Hpi indicates hours post-inoculation.

